Deciding Between Windows and Linux VPS: Which
When selecting a Virtual Private Server (VPS), the choi...








A Russia-facing trading server should not be selected by geographic distance alone. Before migrating a trading bot, test every critical exchange endpoint from each candidate region and compare DNS behavior, packet loss, TCP and TLS timing, WebSocket stability, and P50, P95, and P99 latency.
SurferCloud provides cloud infrastructure in Russia and other global locations, allowing trading teams to evaluate candidate routes before committing to a production migration.
Consider a trading team preparing to move an execution bot from a general European server to a region geographically closer to Russia. The initial assumption is straightforward: a shorter physical distance should reduce order latency.
However, an example pre-migration test might show one exchange REST endpoint averaging approximately 90 milliseconds from the nearby region while producing P99 spikes above 850 milliseconds. A second candidate region, farther away on the map, might reach the same endpoint through a cleaner route and keep P99 closer to 220 milliseconds.
WebSocket behavior can also vary by exchange. A connection to Exchange A may remain stable while Exchange B experiences heartbeat delays and frequent reconnects from the same server.
Important: The latency figures in this scenario are illustrative examples, not SurferCloud performance guarantees or published benchmark results. Actual performance depends on the source region, exchange endpoint, DNS response, carrier route, server configuration, and test period.
This is the practical challenge behind Russia trading server latency optimization. Latency is not determined only by the distance between a server and Russian users. It depends on the complete path between the trading process, DNS resolver, exchange edge, network carrier, TCP and TLS session, local CPU, storage, and database.
A server described as being near Russia can represent several very different network conditions:
The lowest-latency region for one exchange may therefore be unsuitable for another. Multi-exchange trading systems should test every exchange separately instead of assigning one latency score to an entire region.
A single ICMP ping is not enough for this decision. Trading teams should measure the network, transport, application, compute, storage, and database layers.
| Layer | What to Measure | Why It Matters |
|---|---|---|
| DNS | Resolution time, returned IP, resolver consistency | Different regions may receive different exchange API edges. |
| Network | RTT, packet loss, jitter, P50, P95, and P99 | Establishes the baseline cost and stability of the route. |
| TCP | Connect time, retransmissions, and connection states | Explains delays before an API request is sent. |
| TLS | Handshake duration and session reuse | Can add significant delay to short-lived HTTPS connections. |
| REST API | Order submission time, timeout rate, and retry count | Directly affects execution and cancellation responsiveness. |
| WebSocket | Heartbeat delay, message gaps, and reconnect frequency | Determines market-data and account-stream freshness. |
| CPU | CPU steal, run queue, context switches, and GC pauses | Local scheduling delays can look like network latency. |
| Storage | Disk await, utilization, queue depth, and flush time | Synchronous logs may block the order execution path. |
| Database | Query duration, lock waits, and pool wait time | Order-state persistence may delay processing after execution. |
Before moving production execution services, create a test matrix for every critical API endpoint. Do not combine all endpoints into one average.
At minimum, test:
| Exchange | Endpoint | Region A P50/P95/P99 | Region B P50/P95/P99 | Packet Loss | Timeout Rate | Observation |
|---|---|---|---|---|---|---|
| Exchange A | REST order | 75/140/820 ms | 110/160/230 ms | 0.2% | 0.8% | Region A has lower median latency but unstable tail latency. |
| Exchange A | WebSocket market data | Stable | Stable | 0% | 0% | Both regions may be acceptable. |
| Exchange B | REST order | 130/250/480 ms | 95/140/210 ms | 0% | 0.1% | Region B provides a more consistent route. |
| Exchange C | REST order | 90/180/300 ms | 160/260/600 ms | 0.5% | 1.2% | Region A performs better for this exchange. |
All values in this table are illustrative. Replace them with timestamped measurements from your own target exchanges before making a deployment decision.
Short tests can miss congestion, exchange maintenance, carrier changes, and volatility-related traffic. A useful route evaluation should cover both normal and stressful operating conditions.
A practical baseline is:
Probe frequency must respect the exchange's rate limits and terms of service. Public connectivity tests should not create unnecessary load, and private order endpoints should only be tested in an approved sandbox or with a carefully controlled production procedure.
Accurate time synchronization is essential when comparing logs across servers or estimating event-to-receive delay from an exchange timestamp.
timedatectl status
chronyc tracking
chronyc sources -v
If the clock offset is unstable, do not treat one-way latency calculations as reliable. RTT measurements remain useful, but timestamps from different systems cannot be compared accurately without synchronized clocks.
Start with basic network visibility and then move upward to transport and application timing. Run the same workflow from every candidate server.
ping -c 100 exchange-api.example.comReview:
ICMP may be filtered or deprioritized, so ping is only a baseline. It does not measure the complete HTTPS order path.
mtr -rwzc 100 exchange-api.example.comIntermediate-hop loss does not always indicate end-to-end packet loss because routers may deprioritize ICMP responses. Focus on loss that continues to later hops and correlates with TCP retransmissions, REST timeouts, or WebSocket gaps.
traceroute exchange-api.example.com
traceroute -T -p 443 exchange-api.example.com
Compare candidate regions for patterns such as:
Traceroute usually shows only the outbound path. The return path may differ, so application-level measurements remain necessary.
Create a file named curl-format.txt:
time_namelookup:   %{time_namelookup}
time_connect:      %{time_connect}
time_appconnect:   %{time_appconnect}
time_pretransfer:  %{time_pretransfer}
time_starttransfer:%{time_starttransfer}
time_total:        %{time_total}
remote_ip:         %{remote_ip}
http_code:         %{http_code}
Run:
curl -w "@curl-format.txt" \
  -o /dev/null \
  -sS \
  https://exchange-api.example.com
Most curl timing values are cumulative from the beginning of the request. Calculate the approximate phase durations as follows:
DNS duration        = time_namelookup
TCP duration        = time_connect - time_namelookup
TLS duration        = time_appconnect - time_connect
Pre-transfer delay  = time_pretransfer - time_appconnect
Server/TTFB phase   = time_starttransfer - time_pretransfer
Response phase      = time_total - time_starttransfer
A request to a public homepage does not represent private order latency. Order submission can also include local signing, task queueing, connection acquisition, exchange authentication, rate-limit waiting, and internal exchange processing. Instrument the trading application to measure these stages separately.
sudo tcpdump -i any \
  -nn \
  host exchange-api.example.com and port 443
Look for:
ss -s
ss -antp
ss -ant state established
ss -ant state time-wait
ss -ant state syn-sent| Observation | Possible Explanation |
|---|---|
| Many SYN-SENT connections | Connect delays, filtering, route problems, or remote throttling |
| Large TIME-WAIT count | Excessive short-lived connections or ineffective connection reuse |
| Unexpectedly high established count | Connection leak or oversized connection pool |
| Application requests waiting for a connection | Connection pool exhaustion |
REST and WebSocket endpoints may use different gateways and network paths. A region that performs well for REST requests can still produce unstable WebSocket connections.
Use a command-line client for an initial connection check:
websocat wss://exchange-stream.example.com/wsAlternatively:
wscat -c wss://exchange-stream.example.com/wsA command-line connection test is not enough for production qualification. The application should record:
If an exchange message contains a server timestamp, compare it with the local receive timestamp only after confirming that the server clock is synchronized. The result may still include exchange-side queuing and clock differences, so it should not automatically be treated as pure network latency.
Saying that an exchange API responds in approximately 100 milliseconds is incomplete. Trading systems need to understand the entire latency distribution.
| Metric | Example Value |
|---|---|
| Average | 110 ms |
| P50 | 85 ms |
| P95 | 240 ms |
| P99 | 1,150 ms |
These example values describe a system with acceptable median performance but high execution risk during latency spikes. A P99 above one second may contribute to stale decisions, delayed cancellations, or missed fills in fast markets.
Track separate percentiles for:
This separation helps determine whether a spike originates in the network, exchange, application runtime, database, or storage layer.
A server reporting only 40% to 50% CPU utilization can still delay order processing. Average CPU usage does not show scheduler pressure, noisy-neighbor effects, thread-pool queues, runtime pauses, or single-core bottlenecks.
top
htop
vmstat 1
mpstat -P ALL 1
pidstat -u -p <pid> 1
pidstat -w -p <pid> 1| Metric | What It May Indicate |
|---|---|
| CPU steal | Hypervisor scheduling pressure or contention with other workloads |
| Run queue | Runnable processes waiting for CPU time |
| I/O wait | Processes delayed by storage operations |
| Context switches | Too many threads, lock contention, or runtime overhead |
| Involuntary context switches | Scheduler pressure affecting the execution process |
| Per-core utilization | A single saturated core hidden by a low server-wide average |
Keep execution-critical services separate from backtesting, feature generation, batch analytics, and large market-data processing whenever predictable P99 latency is important.
A live trading service may write:
If these writes are synchronous and share a disk with the operating system or database, storage latency can increase application P99.
iostat -x 1
iotop
pidstat -d -p <pid> 1
df -h
du -sh /var/log/*| Metric | Risk Signal |
|---|---|
| await | Read or write operations are taking too long. |
| %util | The device is approaching sustained saturation. |
| Queue depth | Storage operations are waiting before execution. |
| fsync or flush latency | Synchronous persistence may be blocking the application. |
Recommended practices include:
A synchronous remote database write can turn a fast network request into a slow end-to-end transaction. Monitor query time, connection acquisition, locks, and transaction duration.
SHOW VARIABLES LIKE 'slow_query_log';
SHOW FULL PROCESSLIST;
SHOW ENGINE INNODB STATUS;
For a controlled investigation, slow query logging can be enabled:
SET GLOBAL slow_query_log = 'ON';
SET GLOBAL long_query_time = 0.1;
Look for:
Keep order-state and risk-control writes close to the execution service where possible. Reporting, analytics, and historical data can often be processed asynchronously.
The correct architecture depends on exchange-specific route measurements, workload complexity, recovery requirements, and consistency constraints.
This model is appropriate when:
The main risk is that one routing or regional failure affects every exchange worker.
This model assigns each exchange worker to the region with the most suitable route for that exchange.
This approach can improve route selection for multi-exchange systems, but it increases deployment, risk-control, and state-consistency complexity.
A warm standby can support trading, payment, or risk-control services that require operational continuity.
The standby should have:
Do not assume the standby region has acceptable exchange connectivity. Test its REST and WebSocket routes before relying on it.
Heavy analytics and low-jitter execution often have different infrastructure requirements.
| Workload | Compute | Network | Storage | Database |
|---|---|---|---|---|
| Early bot testing | Shared compute may be sufficient | Test every exchange endpoint | Basic storage with log monitoring | Local test database |
| Small live bot | Stable CPU baseline preferred | Track P95, P99, packet loss, and timeouts | Separate frequent logs where practical | Keep hot-path writes near execution |
| Multi-exchange execution | Predictable CPU scheduling | Measure and select routes per exchange | Asynchronous logs and isolated data | Monitor query and pool latency |
| Latency-sensitive API service | Dedicated compute may be appropriate | Persistent connections and continuous monitoring | Higher and more predictable IOPS | Avoid remote synchronous writes |
| Payment or risk-control API | Predictable CPU and memory | Defined timeout and retry budgets | Audit logs isolated from the hot path | Strong indexing and transaction control |
| Multi-region recovery | Standby capacity reserved | Failover routes tested in advance | Critical configuration and logs replicated | Consistency model documented |
SurferCloud provides a Russia location as part of its regional infrastructure options, making it possible to include a SurferCloud Russia cloud server in a route comparison for Russia-facing workloads.
Russia is also identified as one of SurferCloud's locations with a regional deployment advantage. However, the availability of a nearby location should not be interpreted as a guarantee that every exchange API will have lower latency.
A practical validation workflow is:
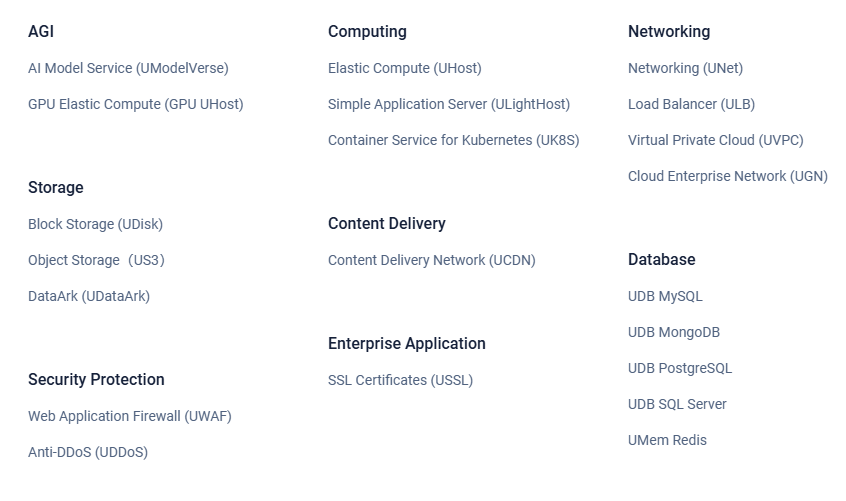
SurferCloud supports cloud infrastructure deployment scenarios that may include cloud servers, databases, and CDN resources for broader application architectures. Its marketing and deployment model also emphasizes hourly purchasing, elastic scaling, and globally distributed availability zones.
| Component | Purpose | What to Measure |
|---|---|---|
| Russia cloud server | Run execution probes and test workers | Exchange-specific REST and WebSocket latency |
| Alternative regional server | Provide a route comparison | P50, P95, P99, loss, and timeout differences |
| Separate data storage | Store logs and market snapshots | Disk await, queue depth, and flush latency |
| Database | Store order state and risk records | Query time, lock waits, and connection pool delay |
| Monitoring service | Collect regional measurements | Route changes, system metrics, and application percentiles |
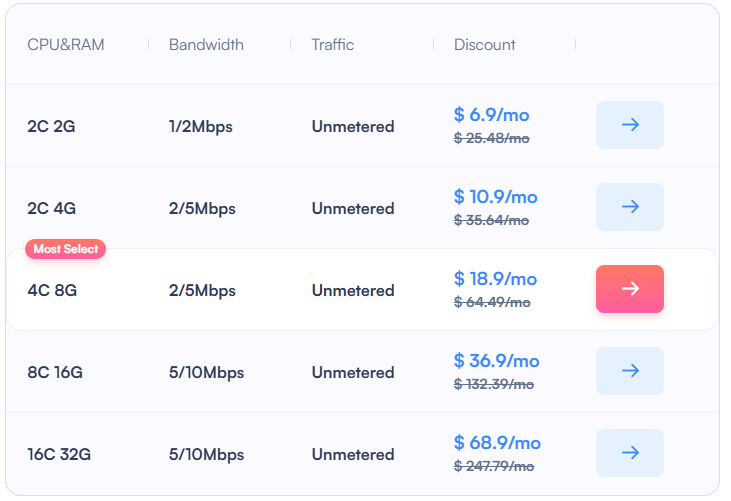
Ask SurferCloud for currently available Russia-region configurations, test access, billing details, and network information. Then benchmark your actual exchange endpoints instead of relying on a generic latency estimate.
Route testing and infrastructure deployment do not guarantee trading outcomes. Latency can change as exchanges, carriers, DNS providers, and network policies change.
There is no universal best region. Select the region by measuring DNS resolution, packet loss, TCP and TLS timing, and P50, P95, and P99 latency to every critical exchange endpoint. A geographically closer server can perform worse when its route includes congestion or an international detour.
Yes. Russia is identified as one of SurferCloud's regional node advantages and can be considered for Russia-facing cloud deployments. Actual exchange API performance should still be tested before migration.
Average latency can hide tail events. A system with a low average may still experience high P99 latency because of route jitter, packet loss, connection pool exhaustion, CPU scheduling, garbage collection, synchronous logging, or slow database operations.
Run ping, MTR, traceroute, curl timing, TCP packet inspection, and connection state checks from every candidate region. Instrument the application to measure signing time, task queue wait, connection acquisition, HTTP response time, retries, timeouts, and database writes.
No. WebSocket heartbeat delays may be caused by route jitter, packet loss, CPU scheduling, event-loop blocking, garbage collection, overloaded threads, or local network problems. Compare application and system metrics before assigning the problem to the exchange.
Dedicated or more predictable compute should be considered when stable P99 latency is important or when shared compute shows CPU steal and scheduling variability. Shared compute may still be suitable for route testing, dashboards, low-frequency strategies, and backtesting workers.
A same-region database usually reduces latency for synchronous order-state and risk-control writes. Historical data, reporting, and analytics can often be processed asynchronously or stored separately.
Multi-region deployment can improve resilience, but it also introduces failover, routing, state-consistency, and operational complexity. Test every active and standby region against the real exchange endpoints before relying on it.
A Russia-facing trading server should not be selected solely because it is geographically close to Russia. Exchange API latency depends on DNS behavior, network routing, TCP and TLS connections, exchange edge placement, CPU scheduling, storage, application queues, and database writes.
A reliable migration process follows five steps:
SurferCloud's Russia location can be used as a candidate environment for this measurement process. Deploy comparable test servers, collect several days of exchange-specific data, and scale only after confirming that the selected route meets the application's latency and stability requirements.
Ready to test your exchange routes? Contact SurferCloud with your target exchanges, expected trading hours, CPU and memory requirements, bandwidth profile, and preferred locations. Request a Russia-region test configuration and compare it with other candidate regions before moving production workloads.
Disclaimer: Illustrative latency values in this article are provided only to explain the testing methodology. They are not service-level commitments, investment advice, or guarantees of trading performance. Network conditions and exchange endpoints may change over time.