Best Free YouTube to WAV Converters in 2025:
With the rise of high-definition audio and video in 202...


AI is transforming cloud anomaly detection by identifying unusual patterns in system behavior - like CPU spikes or unexpected traffic surges - faster and more accurately than traditional methods. This ensures better performance, security, and cost management for cloud systems.
Key takeaways:
AI-powered systems like SurferCloud analyze historical data, monitor in real-time, and adapt to changing patterns, enabling faster, more precise responses to potential issues.
AI-driven anomaly detection depends heavily on gathering telemetry data. The more detailed and wide-ranging this data is, the better the system can differentiate between normal operations and actual threats. Cloud platforms collect data from three main sources: metrics (performance indicators), logs (event records), and traces (pathways of requests through distributed services). Each plays a unique role in creating a clear picture of system health. Getting accurate data is the essential first step in building an effective AI-based anomaly detection system.
Metrics offer numerical measurements that track resource usage over time, such as CPU usage, memory consumption, disk I/O, and network throughput. These measurements help define what "normal" behavior looks like for your systems. For example, if CPU usage suddenly spikes from 30% to 95% during non-peak hours, metrics can quickly flag this as unusual activity.
Logs capture detailed records of specific events, such as API calls, authentication attempts, application errors, and network traffic patterns. For instance, NetFlow logs document source and destination IP addresses, port numbers, and the amount of data transferred. With mobile data traffic expected to hit 77.5 exabytes per month by 2022 - growing at a compound annual rate of 46% [8] - the sheer volume of log data to analyze has grown massively. Logs are essential for understanding the root cause of an anomaly, whether it’s a misconfigured service, a software bug, or an unauthorized access attempt.
Traces track individual requests as they move through microservices in distributed environments. These are vital for identifying issues like latency bottlenecks or broken dependencies that may not show up in metrics alone. Some advanced systems also monitor hardware performance counters (HPCs), which track processor-level data like cache misses and instruction counts. According to a Princeton University study, the top three hardware markers for identifying normal system behavior were Instructions (26.7%), Stall during issue (18.9%), and Stall during retirement (17.8%) [1]. These markers are especially useful for spotting stealthy attacks, such as Spectre and Meltdown, that exploit vulnerabilities at the microarchitectural level.
Raw telemetry data only paints part of the picture. For example, a surge in database queries during a flash sale is expected, but the same spike at 3:00 AM might be a red flag. This is where contextual metadata - like user roles, geographic locations, timestamps, and system states - becomes essential.
"Contextual anomalies are only identifiable when data is viewed within its specific context: what seems normal in one setting may be unusual in another." - TechMagic [7]
Adding this context significantly improves detection accuracy. For instance, analyzing network logs with geographic metadata can uncover "impossible travel" scenarios, such as a user account logging in from New York and Tokyo within minutes. Similarly, tagging data with user roles helps the system differentiate expected activity - like elevated database access by an administrator - from suspicious behavior, such as a marketing intern accessing sensitive data.
When training anomaly detection models, it’s crucial to exclude known events like scheduled maintenance or software updates [2]. These events represent deliberate, temporary deviations from the norm and shouldn’t be included in the baseline. Additionally, when working with sensitive information, such as subscriber IDs or personally identifiable data, use deterministic encryption or tokenization [8]. This approach safeguards privacy while still allowing you to correlate events across your systems.
Once you've collected telemetry data, the next step is selecting machine learning models to analyze it. In most cloud environments, data isn't neatly labeled to differentiate "normal" behavior from potential attacks. This is why unsupervised learning models have become the go-to choice. These models excel at spotting unusual patterns without needing predefined examples, marking a shift from static, rule-based monitoring to AI-powered systems that adapt to the complexities of multicloud environments.
Isolation Forest is a standout in anomaly detection. Instead of profiling normal data, it isolates anomalies by randomly partitioning the data. Lanir Shacham, CEO of Faddom, explains:
"Isolation Forest... isolates anomalies instead of profiling normal data points. The algorithm creates random partitions of data and measures how many splits are required to isolate a point. Anomalies, being few and different, are isolated faster" [6].
Research shows that Isolation Forest often outperforms other unsupervised methods, such as One-Class SVM, in achieving a balance between precision and recall [10].
Other effective models include K-means clustering, which organizes data points into groups based on shared characteristics. Anomalies stand out as data points far from cluster centers or in sparse, small clusters [9]. Similarly, autoencoders work by compressing and reconstructing normal data. When faced with unfamiliar patterns, these models produce high reconstruction errors, signaling potential anomalies [9] [5].
Time-series analysis builds on the insights from unsupervised models by focusing on temporal patterns. Cloud workloads often follow predictable rhythms - for example, CPU usage may spike during business hours, while network traffic typically dips on weekends. Time-series models can capture these trends and highlight deviations.
A practical example comes from Microsoft, which developed a time-series anomaly detection service using Spectral Residual and Convolutional Neural Networks. This service monitors real-time metrics such as page views and revenue [12]. IBM's Anomaly Detection Service API has also seen extensive use, with over 500,000 API calls recorded between January 2022 and mid-2024 for both batch and streaming data scenarios [13]. Additionally, in January 2025, Moralis, a Web3 development platform, partnered with DoiT International to implement machine learning-based anomaly detection for cloud cost management, leading to a 10% reduction in cloud expenses [5].
To refine anomaly detection further, AI models can establish dynamic baselines by analyzing historical data. For instance, AWS CloudWatch can train on up to two weeks of metric data to create a baseline [2]. These baselines account for expected seasonal variations, like higher traffic during business hours, while flagging similar activity during off-peak times as potential issues. Unlike static thresholds - such as triggering an alert only when CPU usage exceeds 80% - dynamic thresholds adjust automatically as system behavior evolves, catching anomalies even within typical ranges.
Michael Chen, Senior Writer at Oracle, emphasizes this shift:
"AI anomaly detection changes the process from a static set of statistical rules to a more flexible model trained to create a baseline for 'normal'" [4].
When training these models, it's crucial to exclude known events, like scheduled maintenance or software updates, to ensure the baseline reflects genuine system behavior. This approach lays the groundwork for real-time monitoring and alerting, advancing the capabilities of AI-driven anomaly detection.
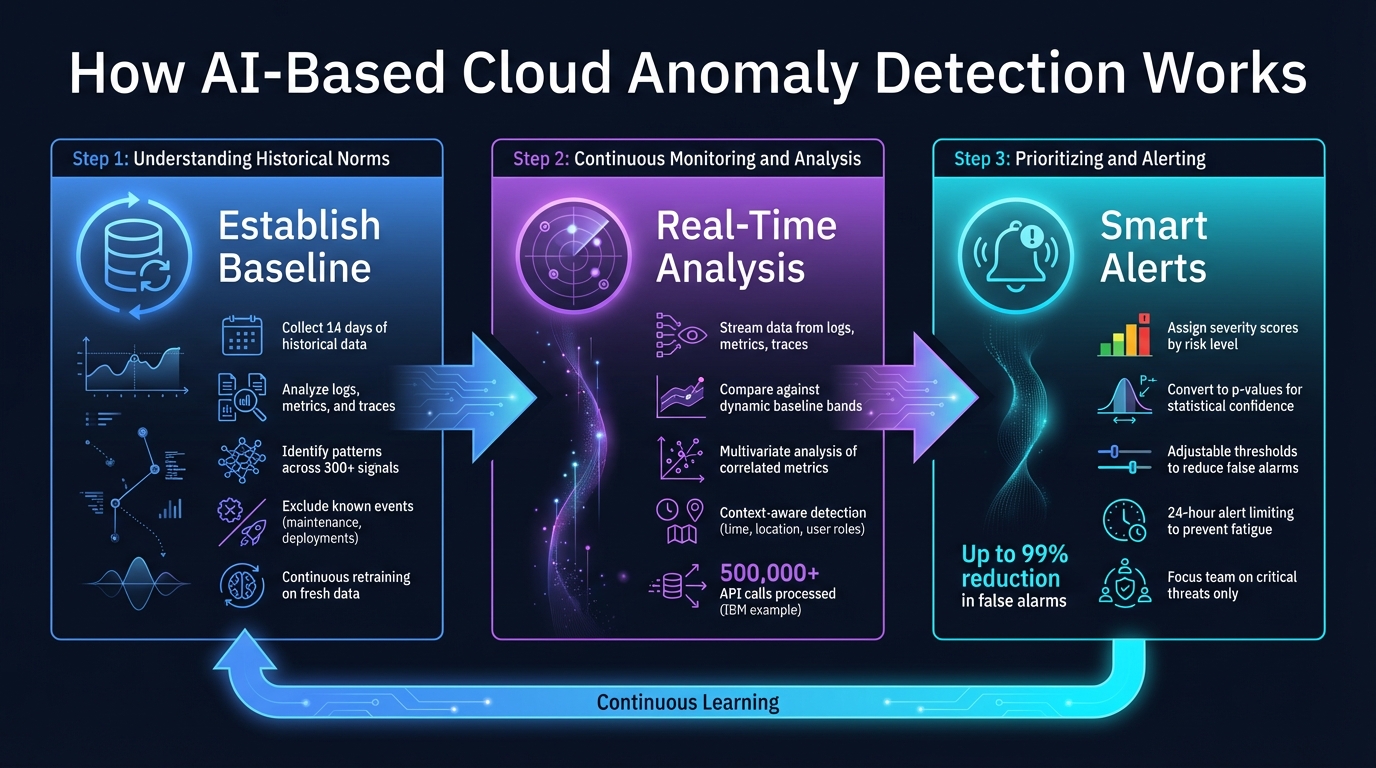
How AI-Based Cloud Anomaly Detection Works: 3-Step Process
AI-powered anomaly detection takes raw cloud data and turns it into actionable alerts, helping teams tackle risks before they escalate. At its core, this process relies on setting a baseline for normal activity, analyzing incoming data in real time, and issuing alerts that highlight potential threats, allowing for swift and informed responses.
Before detecting anomalies, the AI needs a clear picture of what "normal" looks like in your cloud environment. This process starts by gathering historical data from logs, metrics (like CPU usage, memory consumption, and task scheduling), and traces. Once collected, the data is cleaned and normalized to create a reliable foundation. Typically, systems train on up to 14 days of historical data to establish this baseline [2].
The AI identifies key patterns, such as transaction rates, user location trends, or system health metrics. Seasonal usage variations are factored in, and advanced systems can analyze relationships between as many as 300 different signals simultaneously [14]. For instance, metrics like disk I/O, network latency, and memory usage are examined together to understand how they interact under normal conditions.
To maintain accuracy, it's critical to exclude known anomalies from the training data. Events like software rollouts on January 3rd or maintenance on December 28th should be removed to prevent the AI from mistakenly treating unusual behavior as normal [2]. The models don't remain static; they continuously re-train on fresh data, adapting to changes in your cloud environment or business patterns over time.
Once the baseline is set, the system moves into real-time monitoring. It gathers streaming data from logs, metrics, and traces, applying streaming inference to compare each new data point against the baseline [14].
The AI creates a dynamic band of expected values that adjusts for patterns throughout the day, week, or even longer cycles. For instance, if traffic typically hovers around 200 transactions at 3:00 AM but suddenly jumps to 5,000, the system flags this as suspicious. Unlike static thresholds - such as triggering an alert when CPU usage exceeds 80% - this approach considers context, making it far more effective.
In complex cloud environments, multivariate analysis helps spot issues that might otherwise go unnoticed. For example, a slight increase in API response time might not seem alarming on its own. But if it coincides with rising database connection errors and memory usage, it could signal a larger problem. Between January 2022 and July 2024, IBM's anomaly detection service processed over 500,000 API calls to monitor roughly 20,000 Virtual Server Instances, uncovering issues that traditional rule-based systems would have missed [13].
For every detected anomaly, the system assigns a severity score, ranking events by their level of risk and potential impact. These scores are based on how much the event deviates from normal patterns [13] [9].
Some systems go a step further, converting these scores into p-values to show the statistical likelihood that an event is truly anomalous rather than random noise [13]. Security-focused platforms may also weigh factors like the ratio of successful to failed login attempts or the reputation of the source IP address [15].
Alerts are triggered when scores cross predefined thresholds. You can fine-tune these thresholds to balance sensitivity - raising the threshold reduces false alarms but might miss subtle issues. To prevent "alert fatigue", many systems limit certain alerts to trigger only once in a 24-hour period for a specific set of attributes [15]. This ensures your team can concentrate on real threats instead of being overwhelmed by repetitive notifications.
These steps form the backbone of SurferCloud's anomaly detection services, enabling teams to respond to threats quickly and efficiently.

SurferCloud has embedded advanced AI-driven anomaly detection into its cloud services, ensuring seamless integration across compute, database, and network operations. By leveraging REST APIs, SDKs, and CLI tools, the platform monitors thousands of components in near-real-time, offering a robust solution for identifying irregularities [11][16]. It all begins with analyzing historical data - like CPU usage, memory consumption, and network traffic - to establish reliable baselines for detecting anomalies [2].
The system continuously scans security logs and network activity across SurferCloud's 17+ global data centers. This allows it to spot potential attacks or intrusions that would otherwise go unnoticed [4]. Additionally, it provides early alerts for hardware or software issues, helping to reduce downtime and associated costs [11][16]. What sets this system apart is its ability to retrain itself automatically, adapting to changes in data patterns, seasonal fluctuations, and unexpected shifts in system behavior. This ensures the AI remains effective as your cloud infrastructure evolves [2].
SurferCloud goes a step further by offering round-the-clock expert support to refine and optimize its anomaly detection models. This team fine-tunes detection thresholds to strike the right balance - identifying subtle threats without triggering excessive false alarms. They also ensure that events like scheduled maintenance or deployments are excluded from baseline calculations, preventing the AI from misinterpreting these as anomalies [2].
While the AI adapts to new trends and patterns on its own, SurferCloud's experts provide the critical human oversight needed to enhance contextual understanding. This ensures the system can differentiate between harmless irregularities and genuine security risks [17]. With this combination of automated adaptability and expert refinement, SurferCloud stays ahead of evolving security challenges and operational needs.
AI-powered anomaly detection is changing how cloud workloads are managed. Instead of depending on static, manually updated rules, AI creates dynamic baselines that adjust to seasonal trends, traffic surges, and shifting system behaviors. This forward-thinking approach not only reduces downtime costs but also lightens the workload for IT teams.
With advanced AI systems, false alarms can be reduced by as much as 99% [18], allowing teams to concentrate on real threats. When dealing with billions of records in complex, distributed systems, AI has the ability to detect subtle patterns that traditional methods often overlook. This is especially helpful for organizations operating in multicloud environments, where security protocols and custom APIs are deeply integrated.
These capabilities make AI a standout solution for today’s cloud management challenges.
"AI anomaly detection is commonly more powerful, more accurate, and faster than traditional anomaly detection, making it a useful business tool for many organizations." - Oracle [4]
SurferCloud taps into these AI-driven advantages to deliver real-time anomaly detection across its global data centers. The platform continuously monitors everything - CPU usage, memory consumption, security logs, and network traffic - to provide actionable insights that ensure smooth and secure operations. Whether you're running a small startup or overseeing enterprise-level infrastructure, this combination of AI automation and expert monitoring keeps your cloud environment reliable and ready to scale.
To make the most of AI anomaly detection, start with clean training data by excluding known events like deployments or maintenance. Build feedback loops to continually improve accuracy. With these practices in place, AI becomes a key tool for smarter operations, enhanced security, and improved efficiency across your cloud systems.
AI reduces false alarms by analyzing the usual behavior of cloud workloads using machine learning models. Through context-aware analysis, it interprets variations more effectively, filters out known and trusted entities, and adjusts detection rules over time. This approach helps distinguish normal activity from actual problems, cutting down on unnecessary alerts and prioritizing real issues.
Metrics, logs, and traces are essential pillars of AI-driven anomaly detection, each offering unique insights into system behavior. Metrics deliver continuous streams of numerical data - think CPU usage or network traffic - that AI models can analyze for deviations from normal patterns, such as sudden spikes or dips. Logs, on the other hand, provide detailed records of system events, which machine learning tools can sift through to uncover irregular sequences or unexpected activities. Lastly, traces follow the complete path of a request within a system, making it easier to identify the exact service or component where something went wrong.
When these three data sources are integrated, AI systems gain the ability to monitor cloud workloads in real-time, catch problems early, and speed up troubleshooting efforts. This ensures that systems remain reliable and perform smoothly.
Unsupervised learning models are a great fit for detecting anomalies in cloud environments. Why? Because cloud systems produce massive amounts of ever-changing, often unlabeled data. These models can sift through this data, learn what "normal" looks like, and flag anything that deviates from the norm - all without needing pre-labeled examples.
This method works especially well in cloud systems, where the sheer scale and complexity make manually labeling every anomaly nearly impossible. By learning directly from the data itself, unsupervised models adjust to changing workloads, helping to catch issues more accurately and quickly.
With the rise of high-definition audio and video in 202...
CentOS VPS (Virtual Private Server) is a widely preferr...

Latency (ping) is one of the single most critical metri...


