AlmaLinux vs. Ubuntu: Which Linux Distributio
Choosing the right Linux distribution for your server c...


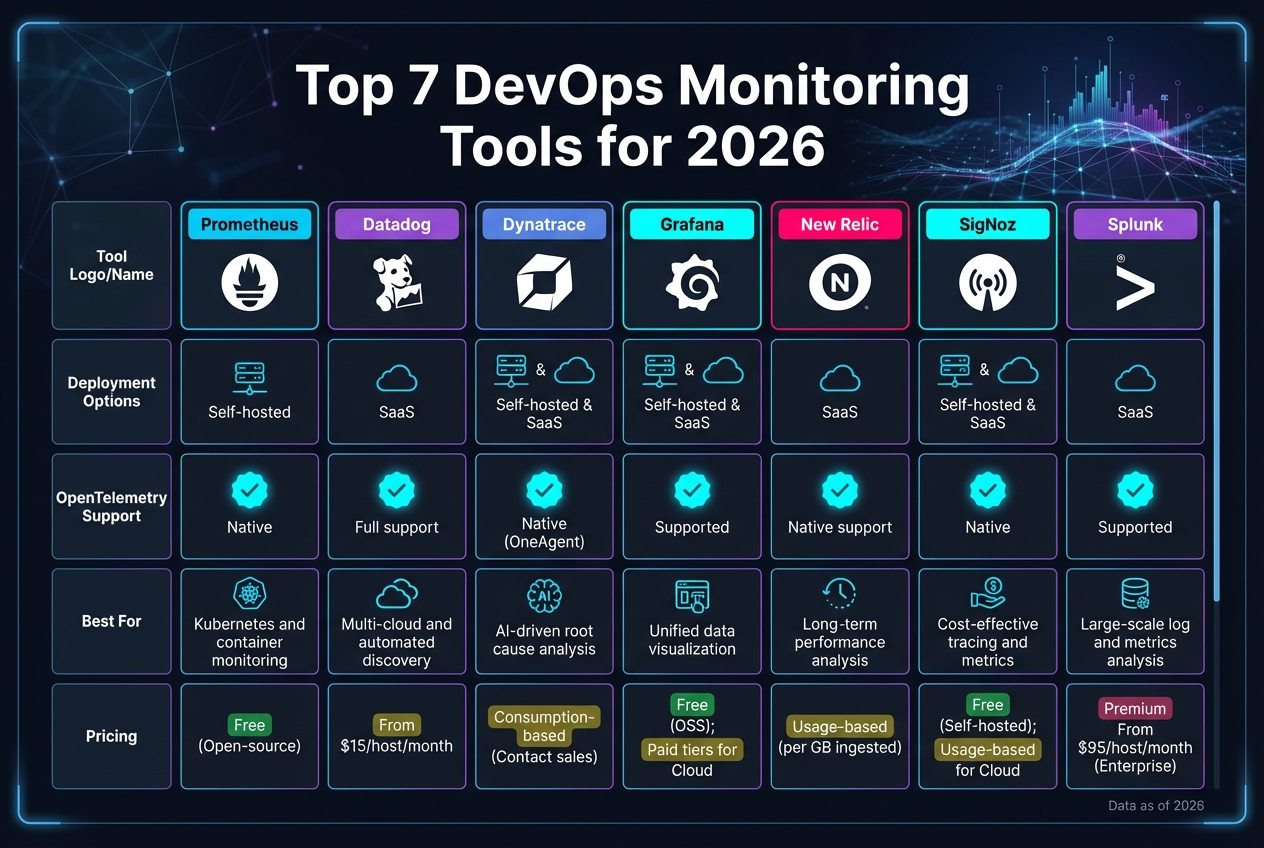
Looking for the best DevOps monitoring tools in 2026? Here's what you need to know:
Modern software systems are complex, relying on microservices, containers, and cloud-native architectures. Simple monitoring isn't enough anymore - observability is now key. Observability tools not only identify issues but also help pinpoint their causes, enabling faster recovery and smoother operations.
Here are the top 7 tools for DevOps monitoring in 2026:
Quick Comparison:
| Tool | Deployment Options | OpenTelemetry Support | Best For |
|---|---|---|---|
| Prometheus | Self-hosted | Native | Kubernetes and container monitoring |
| Datadog | SaaS | Full support | Multi-cloud and automated discovery |
| Dynatrace | SaaS & On-premise | Native (OneAgent) | AI-driven root cause analysis |
| Grafana | Self-hosted & SaaS | Supported | Unified data visualization |
| New Relic | SaaS | Native support | Long-term performance analysis |
| SigNoz | Self-hosted & SaaS | Native | Cost-effective tracing and metrics |
| Splunk | SaaS | Supported | Large-scale log and metrics analysis |
Each tool offers unique strengths depending on your needs, infrastructure, and budget. Whether you're managing Kubernetes-heavy setups or multi-cloud environments, these tools can help you reduce downtime, improve performance, and streamline DevOps workflows.
Top 7 DevOps Monitoring Tools Comparison 2026
Prometheus has solidified its place as the go-to solution for monitoring Kubernetes and cloud-native infrastructure as of 2026[1]. With over 62,112 GitHub stars and its recognition as the second Cloud Native Computing Foundation graduate, it’s clear that Prometheus is built for the demands of modern microservices[7].
Prometheus uses an HTTP pull model to gather numerical metrics from services at regular intervals[8]. Unlike older systems that rely on agents pushing data, this pull-based approach gives you more control over how often data is collected and helps manage network load. Metrics are stored as time series with key-value pairs (labels), making it easy to filter and analyze data. For example, you can monitor response times by service name, version, or region - all within the same metric.
With PromQL, Prometheus offers real-time capabilities like aggregation, rate calculations, and temporal logic. Whether you’re troubleshooting an issue or setting up automated alerts, PromQL ensures you can pinpoint performance problems quickly, all while maintaining sub-second query times[7].
Prometheus works seamlessly with the OpenTelemetry ecosystem, supporting the OpenTelemetry Protocol (OTLP) for both ingestion and export via the OpenTelemetry Collector[1]. This interoperability ensures you aren’t locked into a specific vendor while still benefiting from Prometheus as a powerful metrics engine. Additionally, Prometheus provides official instrumentation libraries for 10 programming languages, making it straightforward to instrument applications[4].
In cloud-native environments, Prometheus shines with its native service discovery for Kubernetes and major cloud providers[7]. It automatically detects and monitors new pods and services, eliminating the need for manual configuration. Each Prometheus server operates independently with local storage, ensuring it remains operational for troubleshooting even if other parts of your infrastructure fail[8]. As highlighted in Site Reliability Engineering: How Google Runs Production Systems:
"Even though Borgmon remains internal to Google, the idea of treating time-series data as a data source for generating alerts is now accessible to everyone through those open source tools like Prometheus."[7]
This level of integration supports dynamic scaling across clusters effortlessly.
As your infrastructure grows, Prometheus scales along with it. Its service discovery mechanisms automatically detect new targets, reducing manual effort[7]. For large-scale setups or long-term data retention, you can pair Prometheus with backends like Thanos or VictoriaMetrics to enable global querying across multiple clusters[1]. Tools like Node Exporter can be used to collect essential system metrics, while Grafana provides interactive dashboards for visualization[9].
That said, careful management of cardinality is essential. Labels with high cardinality, such as user IDs, can negatively impact performance and increase storage requirements. It’s best to stick with labels that represent limited sets, like service names, regions, or environments[6].
Prometheus uses PromQL to define alerting rules, while the separate Alertmanager component handles notifications, silencing, and inhibition[7]. Alertmanager can integrate with incident management platforms or event buses like AWS EventBridge to trigger automated responses. These might include restarting instances, clearing logs, or rolling back deployments, enabling faster recovery and minimizing downtime[10]. This level of automation transforms Prometheus from a simple monitoring tool into a key player in self-healing infrastructure.
Prometheus is entirely open source under the Apache License 2.0[7]. For those seeking managed services, Amazon Managed Service for Prometheus charges around $0.90 per 10 million samples ingested[5]. However, many teams opt for self-hosted setups, where costs are primarily tied to the underlying infrastructure.
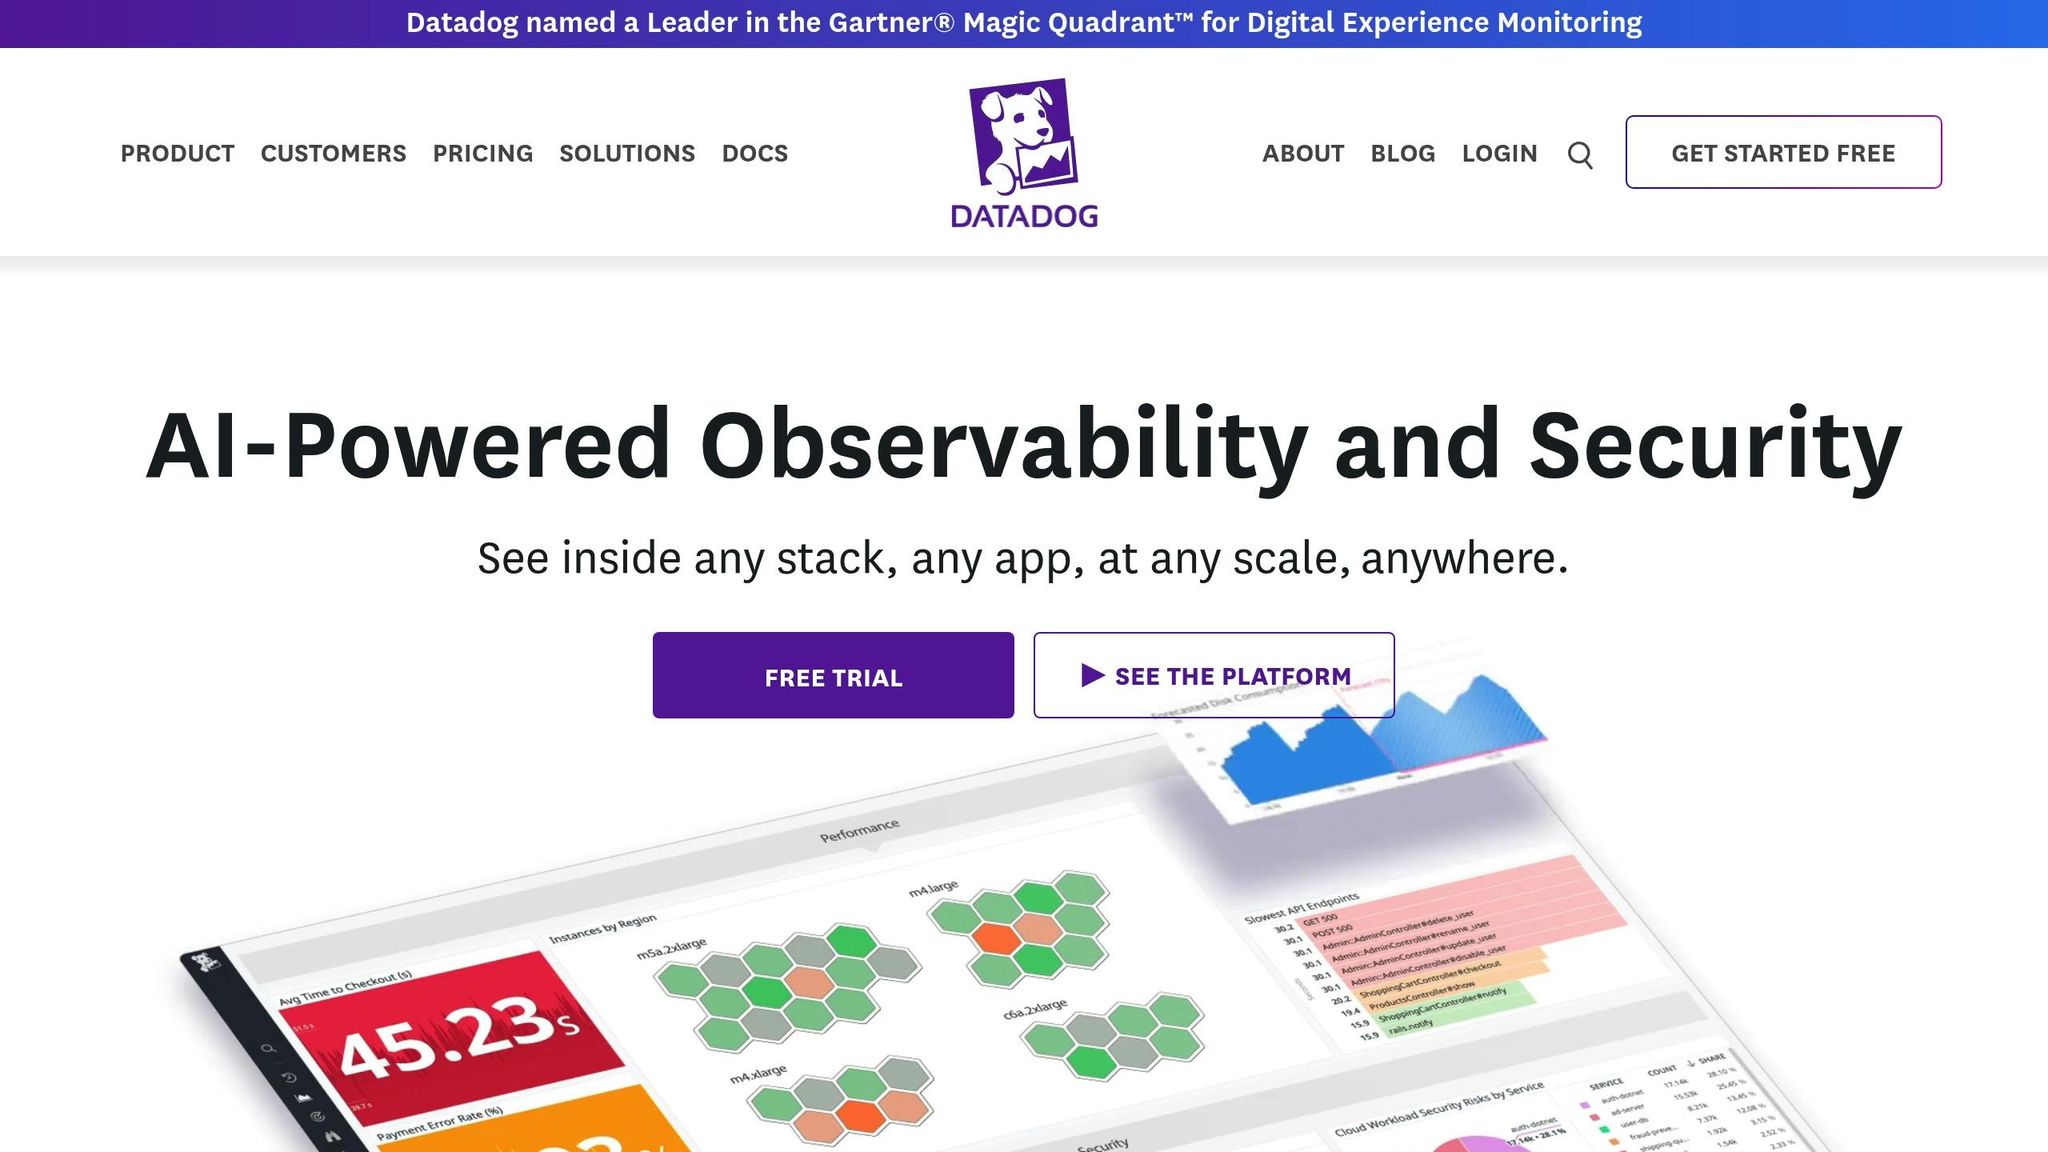
Datadog brings together metrics, logs, and traces into a single interface. This streamlined view allows teams to quickly dive into related traces and logs when a metric shows issues, making troubleshooting faster and more efficient [11]. These features align perfectly with the needs of modern DevOps pipelines.
Datadog integrates with over 1,000 tools, covering major cloud providers like AWS, Azure, and Google Cloud Platform, along with Kubernetes and serverless environments [11]. Customizable dashboards provide real-time visibility into key metrics, such as CPU usage and service dependencies. Its Watchdog AI identifies anomalies and enables distributed tracing without requiring any code changes [13].
The platform’s DDOT Collector processes OpenTelemetry data, mapping resource attributes and metrics for seamless integration into both native and hybrid environments [13]. For Kubernetes, Datadog offers enhanced visibility through tools like the Orchestrator Explorer and Kubernetes Autoscaling, supported by its Operator and DaemonSet deployments. Serverless monitoring is also available for services like AWS Lambda, Azure App Service, and Google Cloud Run, with auto-instrumentation that doesn’t require developers to modify code. As a testament to its capabilities, Datadog was named a Leader in the 2025 Gartner Magic Quadrant for Observability Platforms [13] [14].
Datadog’s real-time insights extend to improving DevOps workflows. Features like CI Visibility and Test Optimization offer a clear view of CI/CD pipeline health by identifying flaky tests and pinpointing bottlenecks [15]. The platform also tracks DORA metrics - Deployment Frequency, Lead Time for Changes, Change Failure Rate, and Time to Restore Service - providing valuable insights into team performance. Integration with IDEs like VS Code and JetBrains supports shift-left testing, allowing developers to address performance issues earlier in the development process. Additionally, the Change Tracking feature links application performance directly to code deployments, feature flags, and configuration changes in real time [13].
Datadog’s automation capabilities enable actions like auto-remediation or rollbacks based on performance data, creating efficient feedback loops [13]. Alerts, organized by tags, can notify teams via Slack, JIRA, and PagerDuty. The Software Catalog centralizes information on service owners and runbooks, reducing response times during incidents. Datadog’s pricing adjusts based on team size, and a 14-day free trial is available to explore the full suite of features [11] [12].
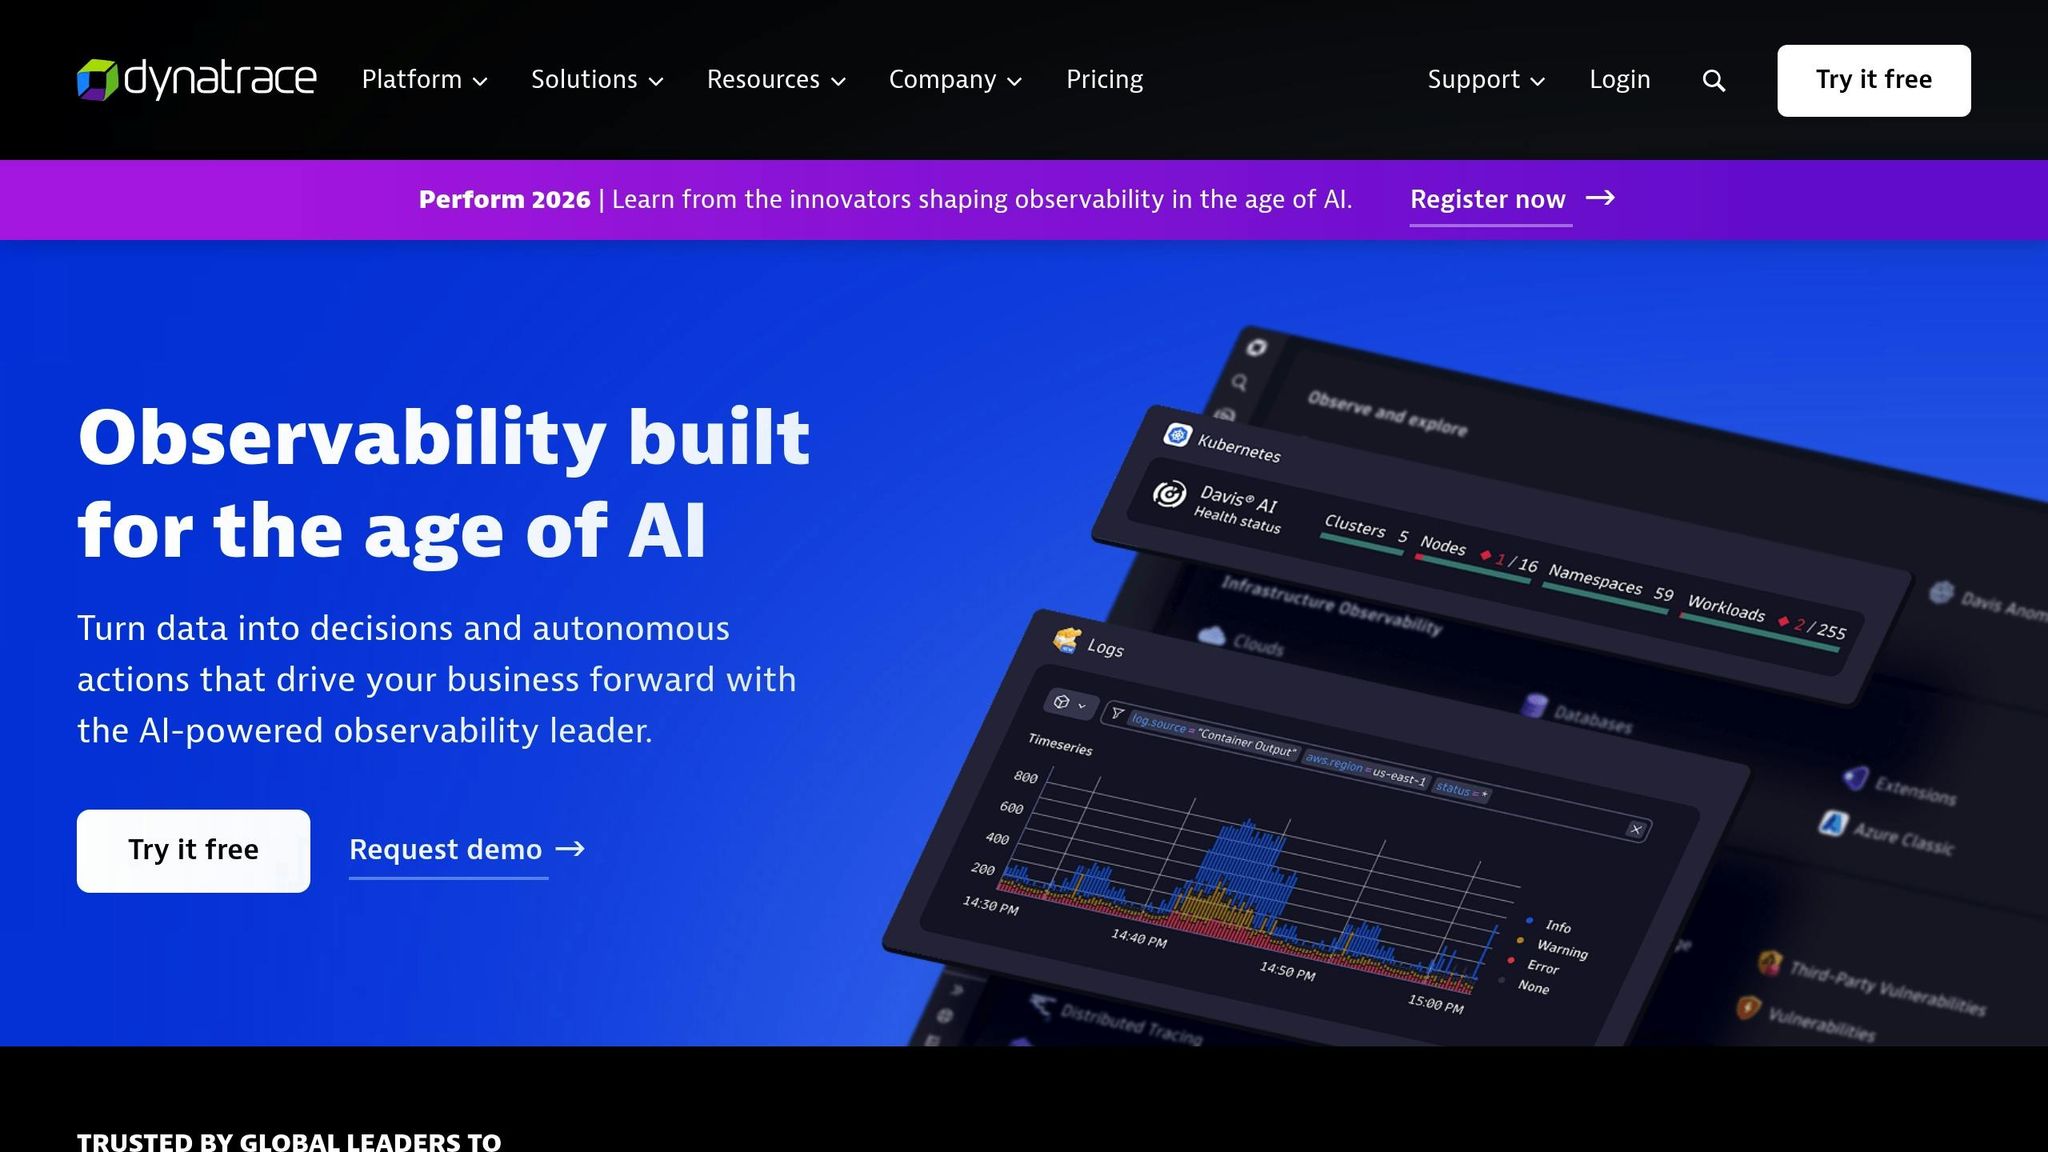
Dynatrace has made a name for itself in the world of cloud observability by offering AI-powered insights and automation. A key feature is its OneAgent technology, which simplifies the process of collecting metrics, traces, and logs. With a single deployment per host, it automatically gathers data across your entire application delivery chain, eliminating the need for manual setup. Another standout feature is Smartscape topology, which provides a real-time map of dependencies and relationships between applications and infrastructure, giving instant context to every data point.
Dynatrace's PurePath tracing captures detailed, end-to-end distributed traces at the code level for every transaction. This data feeds into Grail, a specialized data lakehouse designed for instant analytics. To make sense of this data, Davis AI employs predictive, causal, and generative models to perform root-cause analysis. For example, in 2025, WeLab Bank integrated Davis AI under the guidance of Chung Wing Mok, slashing the time needed to diagnose system failures from hours to just minutes. Mok explained:
"Dynatrace's Davis AI engine provides us with insights for early detection of potential system issues without false alarms, reducing the time required to identify root causes from hours to minutes" [19].
Dynatrace also excels in supporting OpenTelemetry, offering over 750 pre-built integrations with platforms like AWS, Azure, and Google Cloud [21]. For Kubernetes users, the platform includes Kubernetes Security Posture Management (KSPM) to identify misconfigurations, vulnerabilities, and runtime threats in containerized workloads [16][21]. Impressively, Dynatrace can scale to monitor more than 100,000 hosts at once [20], earning it recognition as a Leader in the 2025 Gartner Magic Quadrant for Observability Platforms [18][19].
Dynatrace's AutomationEngine streamlines BizDevSecOps workflows by converting data into actionable insights. It flags security risks and ensures compliance within CI/CD pipelines before deployment [16]. In 2025, ADT used Dynatrace's business events and OpenPipeline to accelerate innovation. Ryan Gow credited these tools with enabling real-time observability across their digital ecosystem, fueling the company’s growth [19]. Similarly, Alex Hibbitt, Engineering Director at Photobox, highlighted the platform's importance:
"Digital transformation is our top priority, and both Dynatrace and AWS are critical in enabling us to achieve our goals quickly, securely, and cost-effectively" [16].
These integrations create efficient, automated feedback loops that enhance operational workflows.
Dynatrace's OpenPipeline engine processes and enriches data from various sources, enabling high-performance routing for cloud-native streams [19]. With Davis AI, the platform reduces mean time to repair (MTTR) by an impressive 95% through automated root-cause analysis [20]. Dynatrace uses a flexible, usage-based pricing model with no per-user fees, no monthly minimums, and no hidden costs [17]. For those interested, a 15-day free trial is available to explore its capabilities [19].
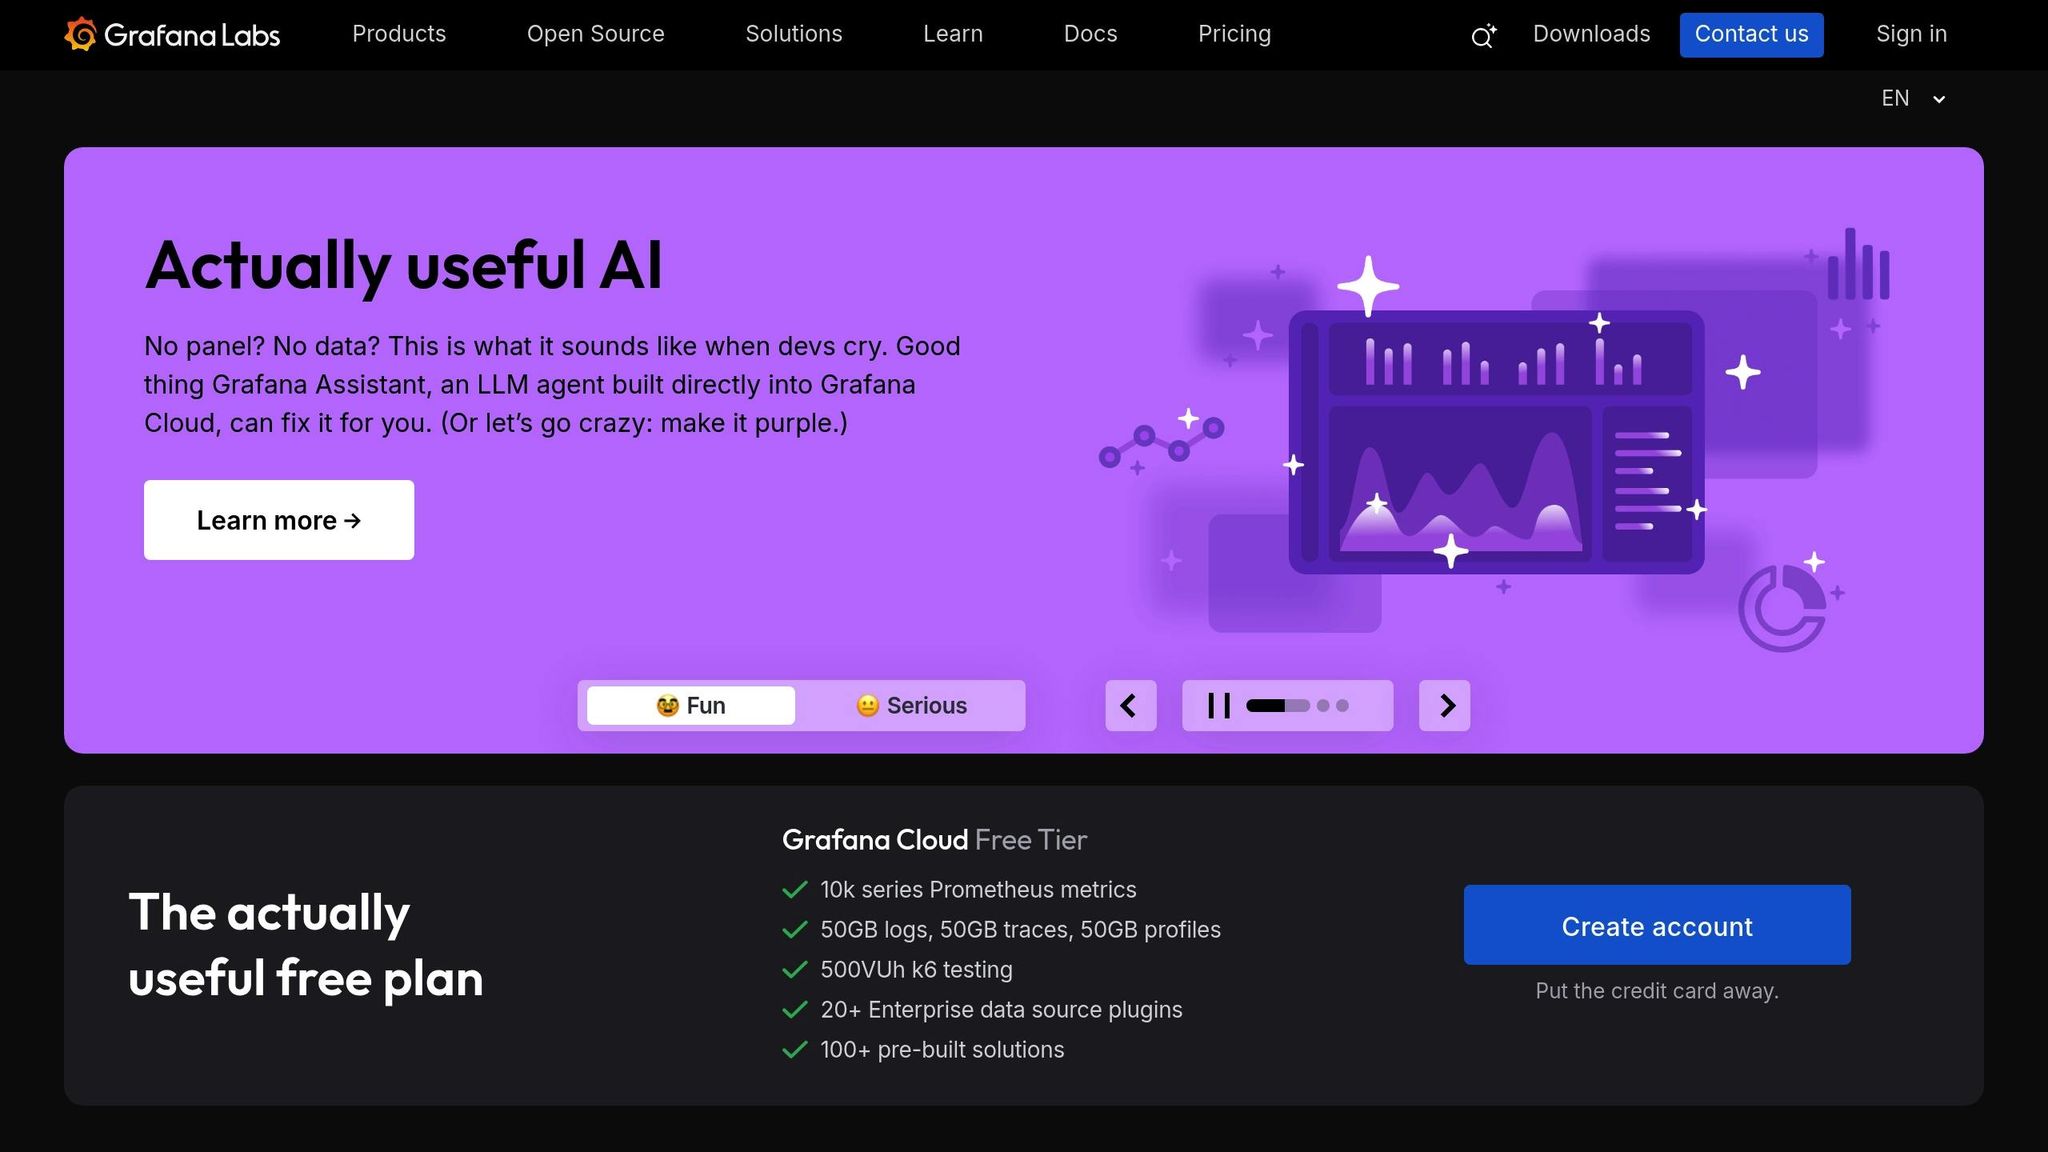
Grafana stands out as a robust observability platform, seamlessly integrating with existing data sources. With its data source plugins, it connects directly to systems like Prometheus, Loki, InfluxDB, and SQL databases via APIs, enabling real-time metric visualization [22][1]. This "single pane of glass" approach simplifies the process of correlating metrics, logs, and traces, allowing users to quickly move from identifying a failing metric to examining related traces and log lines - all with just a few clicks [22][1]. This level of integration ensures precise monitoring and efficient feedback loops, which are essential for cloud automation. Recognized as a Leader in the 2025 Gartner Magic Quadrant for Observability Platforms, Grafana serves a global user base of over 25 million [22][23].
Grafana employs advanced tools for telemetry collection. Its Alloy telemetry collector uses a high-performance push model to gather metrics, logs, and traces, while Grafana Beyla leverages eBPF technology to automatically capture application telemetry [24][1]. The platform's Adaptive Telemetry feature uses machine learning to streamline unused metrics and reduce log volume, cutting through unnecessary noise while managing costs effectively [22][23].
In 2025, Uber's Engineering Manager Shauvik Roy Choudhary highlighted the financial impact of Grafana's solutions, reporting over $1 million in infrastructure cost savings [23]. Similarly, Ron Lipke, Senior Engineering Manager at Mux, shared:
"It not only saves us hundreds of thousands of dollars a year, but it's also a forcing function for us to look closely at our metrics to find additional opportunities for time series reduction and cardinality improvements" [22].
This focus on real-time telemetry underpins Grafana's strong support for cloud-native standards.
Grafana's "LGTM" stack - comprising Loki, Grafana, Tempo, and Mimir - offers a comprehensive solution for managing metrics, logs, and traces in cloud-native settings [22][1]. Its architecture is built to scale efficiently, handling high-cardinality data and delivering rapid query responses, all while utilizing cost-effective object storage solutions like S3 or GCS [22][1]. With over 100 pre-built solutions tailored for Kubernetes, database monitoring, and cloud providers, Grafana simplifies the monitoring of complex, distributed systems [22]. By adhering to strong observability standards, it also enhances DevOps workflows through configuration as code.
Grafana supports configuration as code, enabling teams to manage dashboards and data sources using declarative JSON or YAML files. This approach streamlines version control and automates deployments within CI/CD pipelines [22][25]. Nathan Bellowe, Staff Software Engineer at The Trade Desk, highlighted the benefits of this integration:
"Getting on-call notifications and paging integrated closer to the dashboards and data that help developers diagnose and resolve issues will greatly improve on-call workflows" [22].
Grafana further enhances DevOps efficiency by integrating with tools like k6 for performance testing and incident response management (IRM), automating feedback loops and accelerating release cycles [22].
Grafana refines DevOps feedback loops with its unified alerting pipeline, which consolidates alerts from multiple data sources into a single, streamlined view. This eliminates the need for manual monitoring and reduces operational overhead [26][27]. The platform also features Grafana Assistant, a context-aware LLM agent that can automatically update dashboards or suggest improvements to your observability setup [22].
In 2025, LATAM Airlines reported a 61% reduction in noisy alerts after implementing Grafana Cloud's alerting and routing capabilities, as noted by Carlos Hernandez Saavedra, Head of Cloud & SRE [23]. Similarly, Sailpoint's DevOps Engineer Lydia Clarke shared that Grafana's optimization tools helped reduce metrics volume by 33% [23]. Grafana's free tier includes 10,000 series of Prometheus metrics and 50GB each of logs, traces, and profiles, while paid plans start at $19 per month plus usage [22][23].
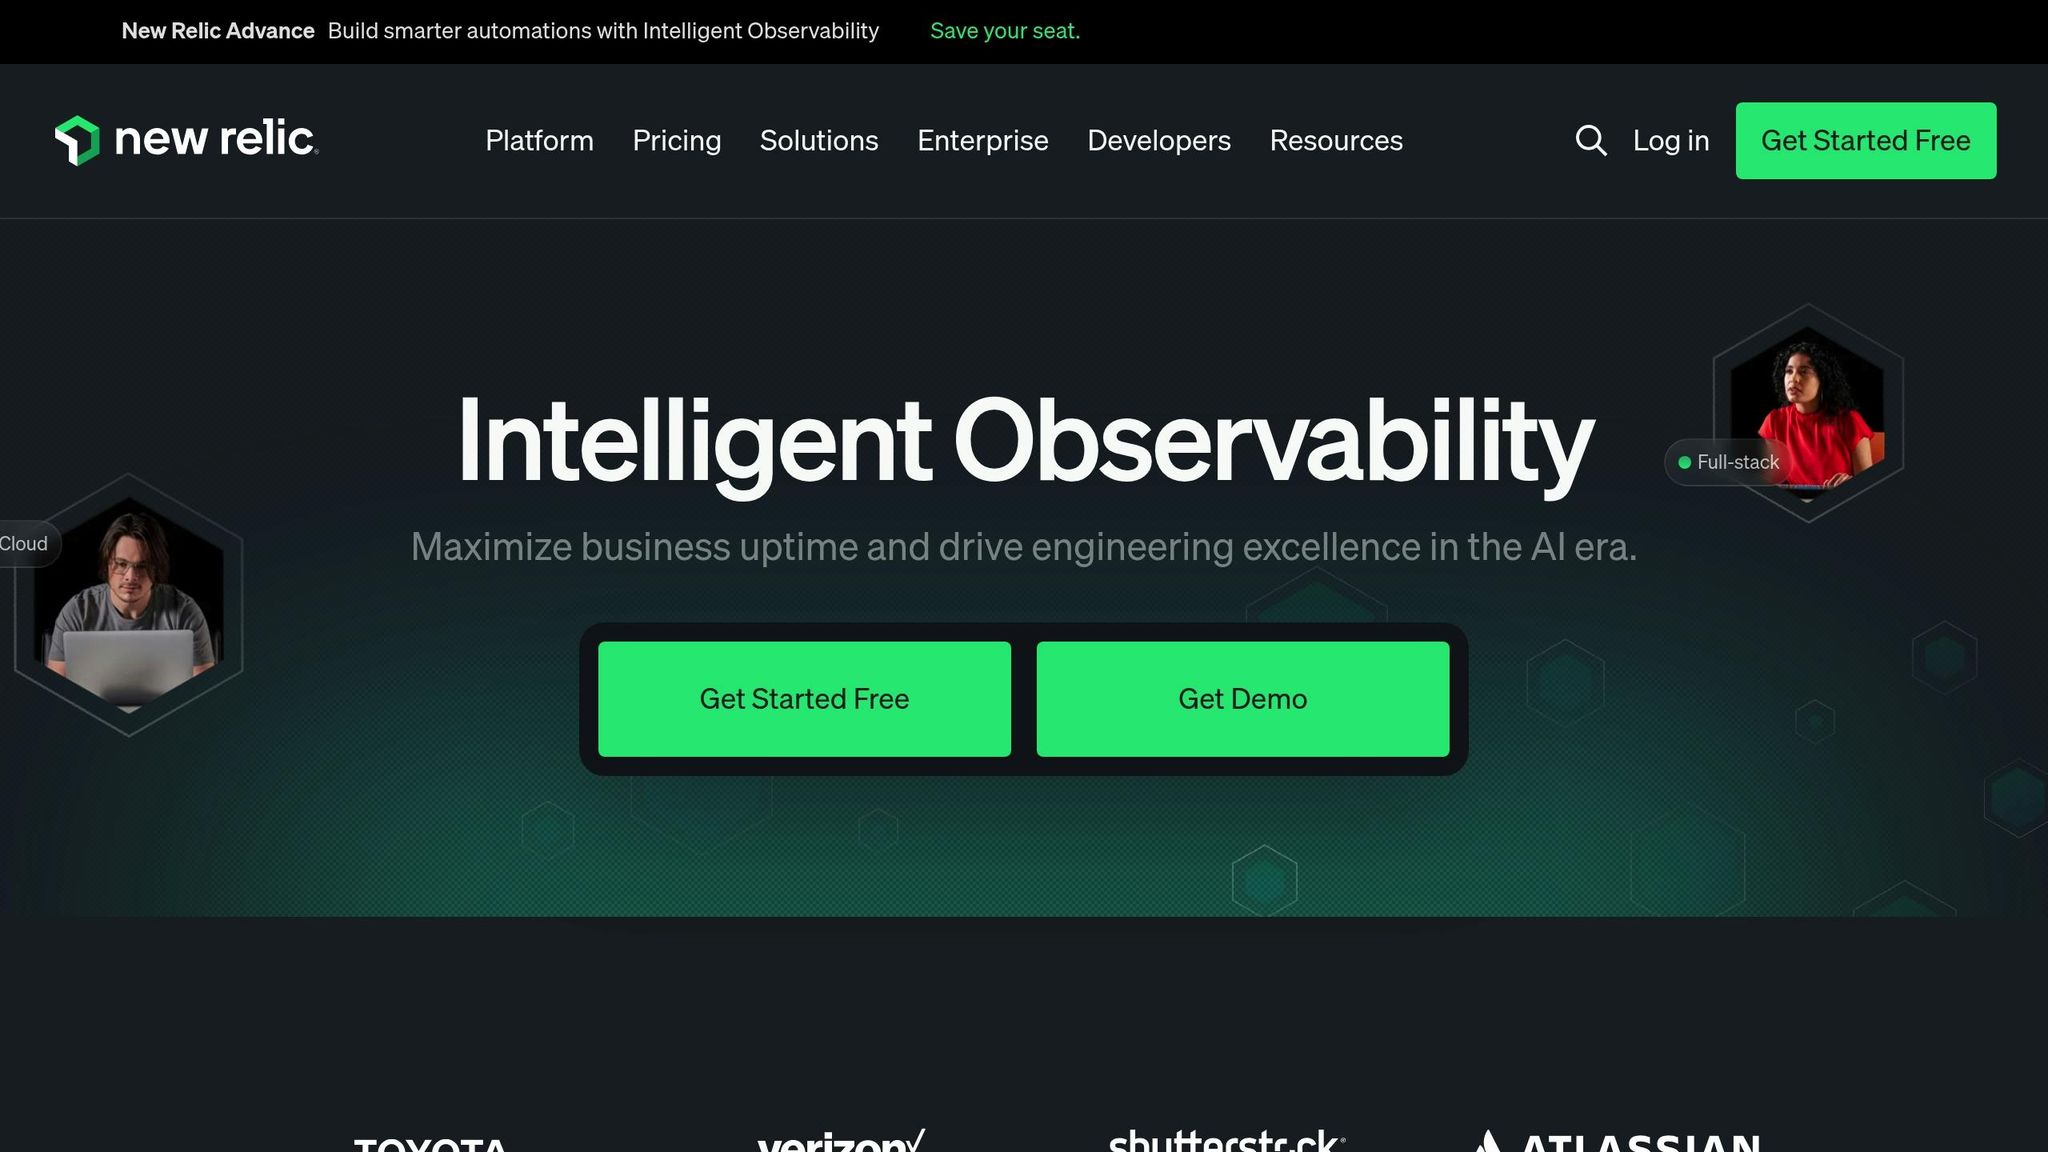
New Relic provides a comprehensive solution for monitoring and managing application performance by bringing together metrics, events, logs, and traces into a single platform. With its NRDB (New Relic Database) and NRQL (New Relic Query Language), DevOps teams can analyze real-time performance data with ease. This allows them to monitor critical performance indicators across various environments, such as spotting CPU usage spikes or identifying slower API response times during deployments - all without hopping between multiple tools. This consolidated approach also lays a solid foundation for OpenTelemetry integration.
New Relic seamlessly integrates with OpenTelemetry, enabling easy instrumentation and data ingestion. This makes it a go-to choice for multi-cloud and containerized setups. By blending its strong application performance monitoring (APM) tools with OpenTelemetry's capabilities, New Relic has positioned itself as one of the leading tools for OTel-native platforms heading into 2026 [28].
Designed with a cloud-native architecture, New Relic can scale horizontally to process billions of data points daily. It also integrates with over 500 tools, making it easy for teams to embed its agents into their CI/CD workflows. These integrations help monitor critical aspects like build times, test failures, and deployment success rates. For example, a mid-sized team managing 100 Kubernetes nodes might spend between $1,500 and $5,000 monthly. Pricing starts at $0.30 per GB of ingested data or $49 per user per month for full platform access [1].
New Relic simplifies incident management with its robust alerting system. Using NRQL-based custom policies, teams can set up notifications for issues like high error rates or breaches in service-level objectives (SLOs). Its automation features work seamlessly with tools like PagerDuty, Slack, and Jira, ensuring quick responses to incidents. AI-powered insights take this a step further by grouping related alerts and offering recommendations, such as scaling resources during traffic surges. In one real-world example, a fintech company reduced its mean time to resolution (MTTR) by 40% by using New Relic to link user sessions with infrastructure metrics, allowing them to quickly identify and resolve database bottlenecks [1].
SigNoz is making waves in the world of DevOps monitoring tools by offering an open-source, OpenTelemetry-based platform for observability. This platform combines metrics, logs, and traces into a single, easy-to-use interface. With over 24,000 stars on GitHub, it’s become a go-to for DevOps teams aiming to avoid vendor lock-in while ensuring full visibility into their cloud-native environments [3][32]. Powered by ClickHouse, a high-performance columnar database, SigNoz delivers quick query processing even with high-cardinality data [31][33].
Since it’s built on OpenTelemetry, SigNoz allows teams to instrument their applications once and maintain flexibility to send telemetry data to any compatible backend without rewriting code [34][2]. It includes pre-configured dashboards for Kubernetes, making it easy to monitor pod restarts, resource usage, and CPU/memory performance across Docker and major cloud providers like AWS, GCP, and Azure [29][31]. For example, in December 2025, Mailmodo used SigNoz to handle over 200GB of daily logs from more than 200 microservices, saving significant time previously spent troubleshooting across multiple tools [33].
SigNoz fits smoothly into DevOps workflows, offering APIs to integrate observability data directly into CI/CD pipelines. It supports ingestion from over 50 sources and includes a DIY query builder for custom dashboards and alerts based on specific thresholds [6][30][2]. Visual tools like topology maps, Flamegraphs, and Gantt charts make it easy to trace request flows and identify bottlenecks [2][33]. While the Community Edition is free and self-hosted, managed plans through SigNoz Cloud start at $49/month, with pricing based on data volume and retention needs [6][31][33].
SigNoz helps teams stay ahead of issues with proactive alerting on any telemetry signal. It supports automated exception recording for popular programming languages like Python, Java, Ruby, and JavaScript [30]. Alerts can be connected to tools like Slack and PagerDuty, creating feedback loops that reduce the time it takes to resolve incidents. The platform’s unified interface lets engineers move seamlessly from identifying a metric spike to examining detailed traces and error logs, cutting out the need for multiple tools during troubleshooting [30][33]. With a growing Slack community of over 4,000 members, users also have access to real-time support and collaboration as they scale their observability efforts [6].
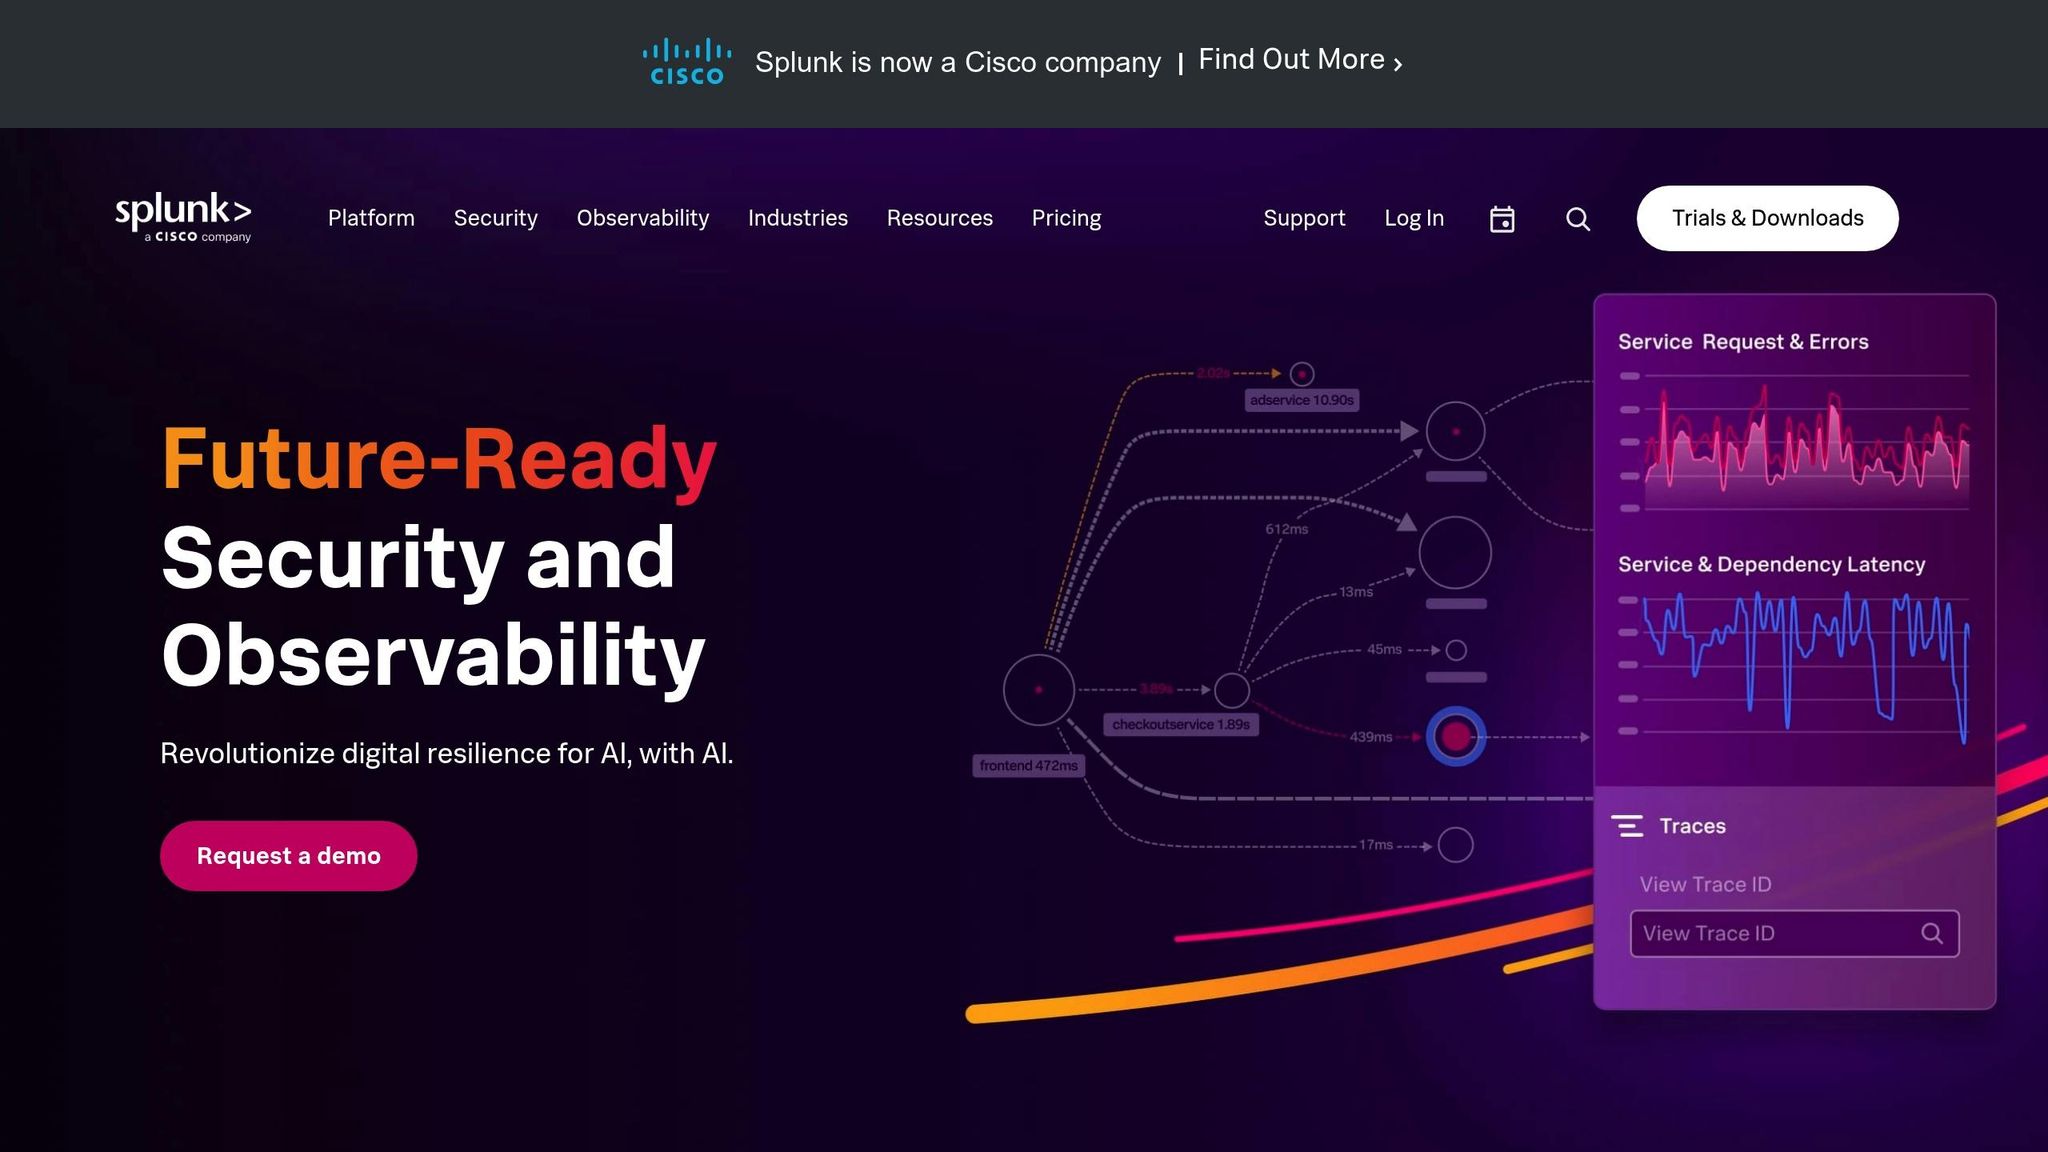
Splunk stands out as a leading observability platform for modern DevOps environments in 2026. As one of the founding members of the OpenTelemetry project, Splunk built its Observability Cloud on open standards, ensuring teams can instrument their applications without worrying about being tied to a specific vendor [37][38]. Its recognition as a Leader in the 2025 Gartner® Magic Quadrant™ for Observability Platforms underscores its reliability for large-scale monitoring needs [38].
Splunk’s streaming pub/sub architecture enables it to ingest, analyze, and alert on metrics within seconds [36][37]. By leveraging NoSample™ tracing, the platform processes 100% of data without sampling, ensuring even the smallest anomalies or intermittent issues are captured [38]. For instance, Rent the Runway used these capabilities in 2025 to achieve a 94% faster Mean Time to Resolution (MTTR) for incidents affecting Service Level Agreements. Under the guidance of Stephanus Meiring, VP of Engineering, the team resolved their last major incident in under 15 minutes [38]. Additionally, Splunk’s SignalFlow analytics language provides a powerful tool for real-time, scalable analytics and sophisticated ad-hoc queries [37].
"Since we've upped our usage and adoption of Splunk, we haven't had an outage and the last critical incident was resolved in less than 15 minutes."
- Stephanus Meiring, VP of Engineering, Rent the Runway [38]
Splunk offers a robust Splunk Distribution of the OpenTelemetry Collector, which simplifies the management of trace and metric data using receivers, processors, and exporters [37][38]. Its Kubernetes Navigator provides intuitive discovery and visualization of Kubernetes objects, health, and performance through dynamic cluster maps [37]. For deeper network insights, Splunk’s eBPF-powered Network Explorer collects detailed telemetry and maps service dependencies without requiring manual setup [37]. The platform also includes over 300 pre-built integrations for cloud services across AWS, Azure, and GCP [36][37]. In 2024, Bosch Rexroth AG used Splunk’s real-time dashboards to enhance visibility across IT and operational technology systems, achieving a 20–30% reduction in energy costs and a 25–30% decrease in greenhouse gas emissions [36].
Splunk’s architecture is designed to handle petabyte-scale log analytics, supported by an independent data store optimized for high-cardinality metadata [37][38]. It enables monitoring-as-code through programmable APIs and a Terraform provider, allowing DevOps teams to create dashboards and alerts directly within CI/CD pipelines [37]. The platform integrates effortlessly with tools like Jenkins, Ansible, and ZooKeeper, ensuring smooth performance monitoring during frequent code deployments [37]. With features like Log Observer Connect, Splunk correlates massive-scale logs with real-time metrics and traces, reducing the need for context switching during troubleshooting [36][38].
Splunk enhances incident response with its AI-powered GenAI Assistant, which provides natural language interaction and expert guidance to speed up root cause analysis [38]. Its streaming architecture ensures real-time alerting, enabling teams to address issues before they escalate [37]. For example, United Airlines used Splunk AppDynamics to achieve full-stack visibility, cutting troubleshooting time in half - from 30 minutes to just 15 [35]. Similarly, Rent the Runway reported a 50% boost in developer efficiency during incidents after adopting Splunk Observability Cloud in 2025 [38]. Splunk offers a 14-day free trial (no credit card required) and flexible usage-based billing with no penalties for overages [35][38].
Here’s a quick side-by-side comparison of the top tools covered earlier. This table highlights key features and pricing to help you make an informed choice.
| Tool | Pricing (USD) | Deployment Options | OpenTelemetry Compatibility | Recommended Use Case |
|---|---|---|---|---|
| Prometheus | Free (Open-source) | Self-hosted | Native | Metrics for Kubernetes & containerized workloads |
| Datadog | From $15/host/month | Cloud-based (SaaS) | Full support | Multi-cloud observability & automated service discovery |
| Dynatrace | Consumption-based (Contact sales) | SaaS & On-premise | Native (via OneAgent) | AI-driven root cause analysis for critical apps |
| Grafana | Free (OSS); Paid tiers for Cloud | Self-hosted & Cloud | Supported (integrates with OpenTelemetry backends) | Unified visualization across multiple data sources |
| New Relic | Usage-based (per GB ingested) | Cloud-based (SaaS) | Native support | Full-stack observability with AI insights |
| SigNoz | Free (Self-hosted); Usage-based for Cloud | Self-hosted & Cloud | Native (built on OpenTelemetry) | Cost-effective tracing for microservices |
| Splunk | From $95/host/month (Enterprise) | Cloud-based (SaaS) | Supported | Large-scale log analysis & streaming analytics |
Prometheus and SigNoz stand out for their OpenTelemetry-native integration, making them excellent choices for Kubernetes environments. They offer seamless instrumentation without relying on proprietary agents.
On the other hand, enterprise solutions like Dynatrace and Splunk justify their premium pricing with advanced features. Dynatrace’s Davis AI engine excels at pinpointing root causes by analyzing thousands of signals, while Splunk’s streaming architecture allows for real-time metric processing.
For hybrid environments spanning on-premises systems and public clouds, Datadog bridges the gap with over 600 integrations and automated service discovery. Grafana is the go-to tool when you need a unified dashboard to visualize data from diverse backends like Prometheus, Elasticsearch, and InfluxDB. Meanwhile, New Relic offers an impressive 13 months of data retention, making it a strong choice for long-term trend analysis and capacity planning.
If managing costs is a priority, especially with consumption-based tools like Datadog or New Relic, implementing strict tagging policies is essential to prevent budget surprises. For teams looking to balance affordability with robust observability, SigNoz delivers a compelling option without compromising on functionality.
Selecting the right monitoring tool depends on your infrastructure, team size, and budget. Each tool has its strengths, tailored to specific needs - whether you're managing Kubernetes-heavy setups or navigating multi-cloud complexities.
For Kubernetes environments, Prometheus is often the go-to choice, offering robust capabilities for containerized workloads. If vendor neutrality and cost efficiency are top priorities, SigNoz shines with its OpenTelemetry-native design and impressive backing, boasting over 24,000 GitHub stars [2][3]. As Gargi Ghosal puts it:
"OpenTelemetry is the future of instrumenting cloud-native applications" [2].
With this approach, you maintain independence from vendors while optimizing real-time monitoring for auto-scaling and self-healing workflows.
Meanwhile, tools like Datadog and Dynatrace excel in multi-cloud environments, offering advanced AI-driven features. Datadog, in particular, has earned recognition in the 2025 Gartner Magic Quadrant and Forrester Wave reports for its cutting-edge capabilities [14].
The cloud monitoring market itself reflects the growing demand for these tools, valued at $2.96 billion in 2024 and projected to reach $9.37 billion by 2030 [39]. Whether you're leveraging Splunk's SIEM for large-scale security log analysis, managing hybrid infrastructures, or running containerized workloads, the right tool can significantly reduce Mean Time to Repair (MTTR) while avoiding unnecessary complexity or budget surprises.
To break it down:
Each of these tools plays a role in automating cloud workflows and creating efficient feedback loops, which are essential for modern DevOps. A well-thought-out choice in monitoring not only simplifies operations but also delivers measurable returns on investment.
While monitoring and observability are often mentioned together in DevOps, they aren't the same thing. Monitoring focuses on keeping tabs on predefined metrics like CPU usage, error rates, or response times. When these metrics breach a set threshold, alerts are triggered. Essentially, monitoring is built to tell you that something is wrong - but it doesn’t dig deeper to explain why it’s happening.
Observability, however, takes things further. It’s about gaining insights into a system’s inner workings by analyzing the data it produces - metrics, logs, and traces. This approach offers a real-time, comprehensive view of the system, allowing teams to investigate problems, identify root causes, and even anticipate potential failures. Simply put, monitoring answers “Is something wrong?” while observability tackles “What’s wrong, and how do we solve it?” - a crucial distinction in today’s intricate, cloud-driven systems.
OpenTelemetry is a standardized, vendor-neutral framework designed to collect and transmit application performance data - covering metrics, logs, and traces. By standardizing the data format, it removes the hassle of creating custom integrations, enabling monitoring tools to effortlessly process telemetry data straight from applications.
This unified system helps teams detect and resolve issues faster. For instance, a performance anomaly spotted on a dashboard can quickly be traced back to specific logs or traces, simplifying root-cause analysis. It also supports automated fixes within CI/CD workflows. On top of that, OpenTelemetry’s flexibility allows teams to add custom attributes or business context to their data, making it more actionable for tasks like setting up alerts, planning capacity, or optimizing costs.
With OpenTelemetry ensuring consistent and reliable data collection, DevOps teams can focus on building a more observable and efficient stack. This lets their tools concentrate on visualization, analytics, and alerting - without the extra headache of managing data integration.
Prometheus stands out as one of the top DevOps monitoring tools tailored for Kubernetes environments. Its ability to integrate effortlessly with Kubernetes makes it a strong choice for tracking metrics, managing alerts, and maintaining system reliability in container-focused workflows.
Designed with cloud-native infrastructures in mind, Prometheus enables teams to monitor distributed systems effectively, making it a trusted solution for setups that heavily rely on Kubernetes.


