Developing RAG Systems with DeepSeek R1 &
Ever wished you could directly ask questions to a PDF o...








Most small applications are sized the same way. Someone looks at what the app needs in development, adds a margin for safety, and buys the cheapest plan that clears that number. The instance runs fine for a few weeks. Then the database grows, or traffic doubles, or a background job starts competing for memory, and the machine that was comfortable in week one is paging to disk by week six.
Sizing is not a purchase decision. It is a measurement problem, and the measurement has to happen before you buy rather than after you are locked into a configuration you cannot change. This is a method for doing it in about half an hour, using only tools that are already on the server.
A spec sheet lists more than four things, but only four of them are the reason an application starts failing. The rest are details that follow from these.
| Resource | How it fails | What the spec sheet tells you |
|---|---|---|
| Memory | Runs out, kernel starts swapping to disk, response times jump from milliseconds to seconds | Total RAM only — says nothing about your app's actual working set |
| Disk IOPS | Random reads and writes queue up; every request slows down at once | Rarely listed, and the figure quoted is a ceiling, not a guarantee |
| Bandwidth | Throughput caps out, connections time out, transfers stall | Often one number when two are needed — see below |
| CPU | Burst capacity runs out and performance drops to a baseline you never measured | Core count, but not whether those cores are shared or dedicated |
The ordering matters. For a typical web application, memory is the first constraint, disk is the second, and bandwidth and CPU are usually last — which is the opposite of how most buyers rank them.
Every guide says to watch free memory, and that advice is slightly wrong. Linux uses spare memory for the page cache and will show very little as free on a healthy machine — that is the kernel doing its job, not a warning.
The number that matters is available memory, which is what the kernel believes it can hand to a new process without swapping. On a running server, take the second line of free -m and read the available column. Then work out what your application's real working set is:
vmstat 1. Any sustained si/so activity at idle means you are already over the line, even if nothing looks slow yet.The practical rule: if available memory falls below about 15% of total under normal load, the next traffic increase will push you into swap. Buy one tier up, or reduce the working set, rather than hoping the peak is the peak.
Disk performance is the most commonly ignored constraint and the most common cause of mysterious slowdowns. Two servers with identical CPU and RAM can behave completely differently because one has fast local NVMe and the other has a network-attached volume shared with other tenants.
The reason it is ignored is that "IOPS" is listed as a single number, which implies a fixed capability. It is not. Storage performance depends on access pattern — sequential reads are cheap, random 4K writes are expensive — and on contention with everything else on the same physical device.
You can measure your own workload's requirement before buying anything, by profiling what the application already does:
dd using a large block size.fio using a 4K block size and a random pattern.If your profiling shows a database doing mostly random 4K reads, that is the requirement to size against — not the total capacity in gigabytes, which is the number vendors prefer to advertise.
Plans are usually sold on a single bandwidth figure, and it is almost always the wrong one to care about. You need to know both:
A 30 Mbps port moving data continuously for a month transfers roughly 9.7 TB. Whether that is generous or restrictive depends entirely on your second number. A site serving mostly text and small images will never approach it. One delivering video or large downloads will exhaust it in days.
There is a third characteristic that is rarely stated and matters enormously: whether the port is shared or dedicated. A shared port draws from a pool, which is why entry-tier plans are affordable and why they perform perfectly well for bursty traffic. A dedicated port guarantees the rate under sustained load. The honest test is whether you can describe your traffic as "mostly idle with peaks" or "always busy" — the first belongs on a shared port, the second will disappoint there.
Core count is the least informative CPU specification for small workloads, because the question is not how many cores you have but whether they are yours.
Shared vCPU means you draw from a pool, with a burst allowance. Idle applications get more than their share, which makes the plan cheap and the performance in testing look excellent. The failure mode is that sustained load exhausts the allowance and you drop to a baseline fraction of a core — often well below what the benchmark showed.
Dedicated vCPU means the cores are allocated to you. Nothing can take them, and performance under sustained load is predictable. This matters for compilation, encoding, sustained API traffic, and anything whose runtime you quote to someone.
For a small web application serving bursty requests, shared cores are entirely adequate and significantly cheaper. For a workload that runs continuously at high utilisation, shared cores are a trap that only reveals itself once you are in production.
You do not need to guess. Run the application somewhere temporary first and collect these five numbers over a representative period — a few days is enough if it includes a peak.
| What to measure | Tool | Buy one tier up if |
|---|---|---|
| Available memory under normal load | free -m |
Below ~15% of total |
| Swap in/out at idle | vmstat 1 |
Any sustained non-zero activity |
| Random 4K read latency under load | fio |
Above a few milliseconds at your normal concurrency |
| Peak sustained outbound throughput | iftop or interface counters |
Above roughly 60% of the port speed |
| CPU steal time | top (the st column) |
Consistently above a few percent — another tenant is consuming your share |
Five numbers, thirty minutes of setup, and a few days of observation. This is cheaper than migrating later, which is the alternative way to learn the same thing.
This is where a purchase decision becomes permanent, and it is the part most buyers skip. Before committing, check each of these against what you actually need:
None of these are reasons to avoid fixed plans. They are reasons to be certain before you buy, because all three are trivially checkable up front and expensive to discover afterwards.
Once you have the five measurements, the tier selection is mechanical. The failure mode is buying one tier too low to save a few dollars a month, then spending a weekend migrating.
The reliable heuristic is the consequence of being wrong. If an undersized instance costs you an evening, buy the cheaper tier and upgrade when the numbers tell you to. If it costs you a customer or a stated uptime commitment, buy the tier that absorbs change.
For the workloads in the first list, a fixed entry-tier plan is the correct purchase and elasticity is a feature you would pay for and never use. The relevant question is only whether the specific plan gives you enough headroom and whether the exit terms are acceptable.
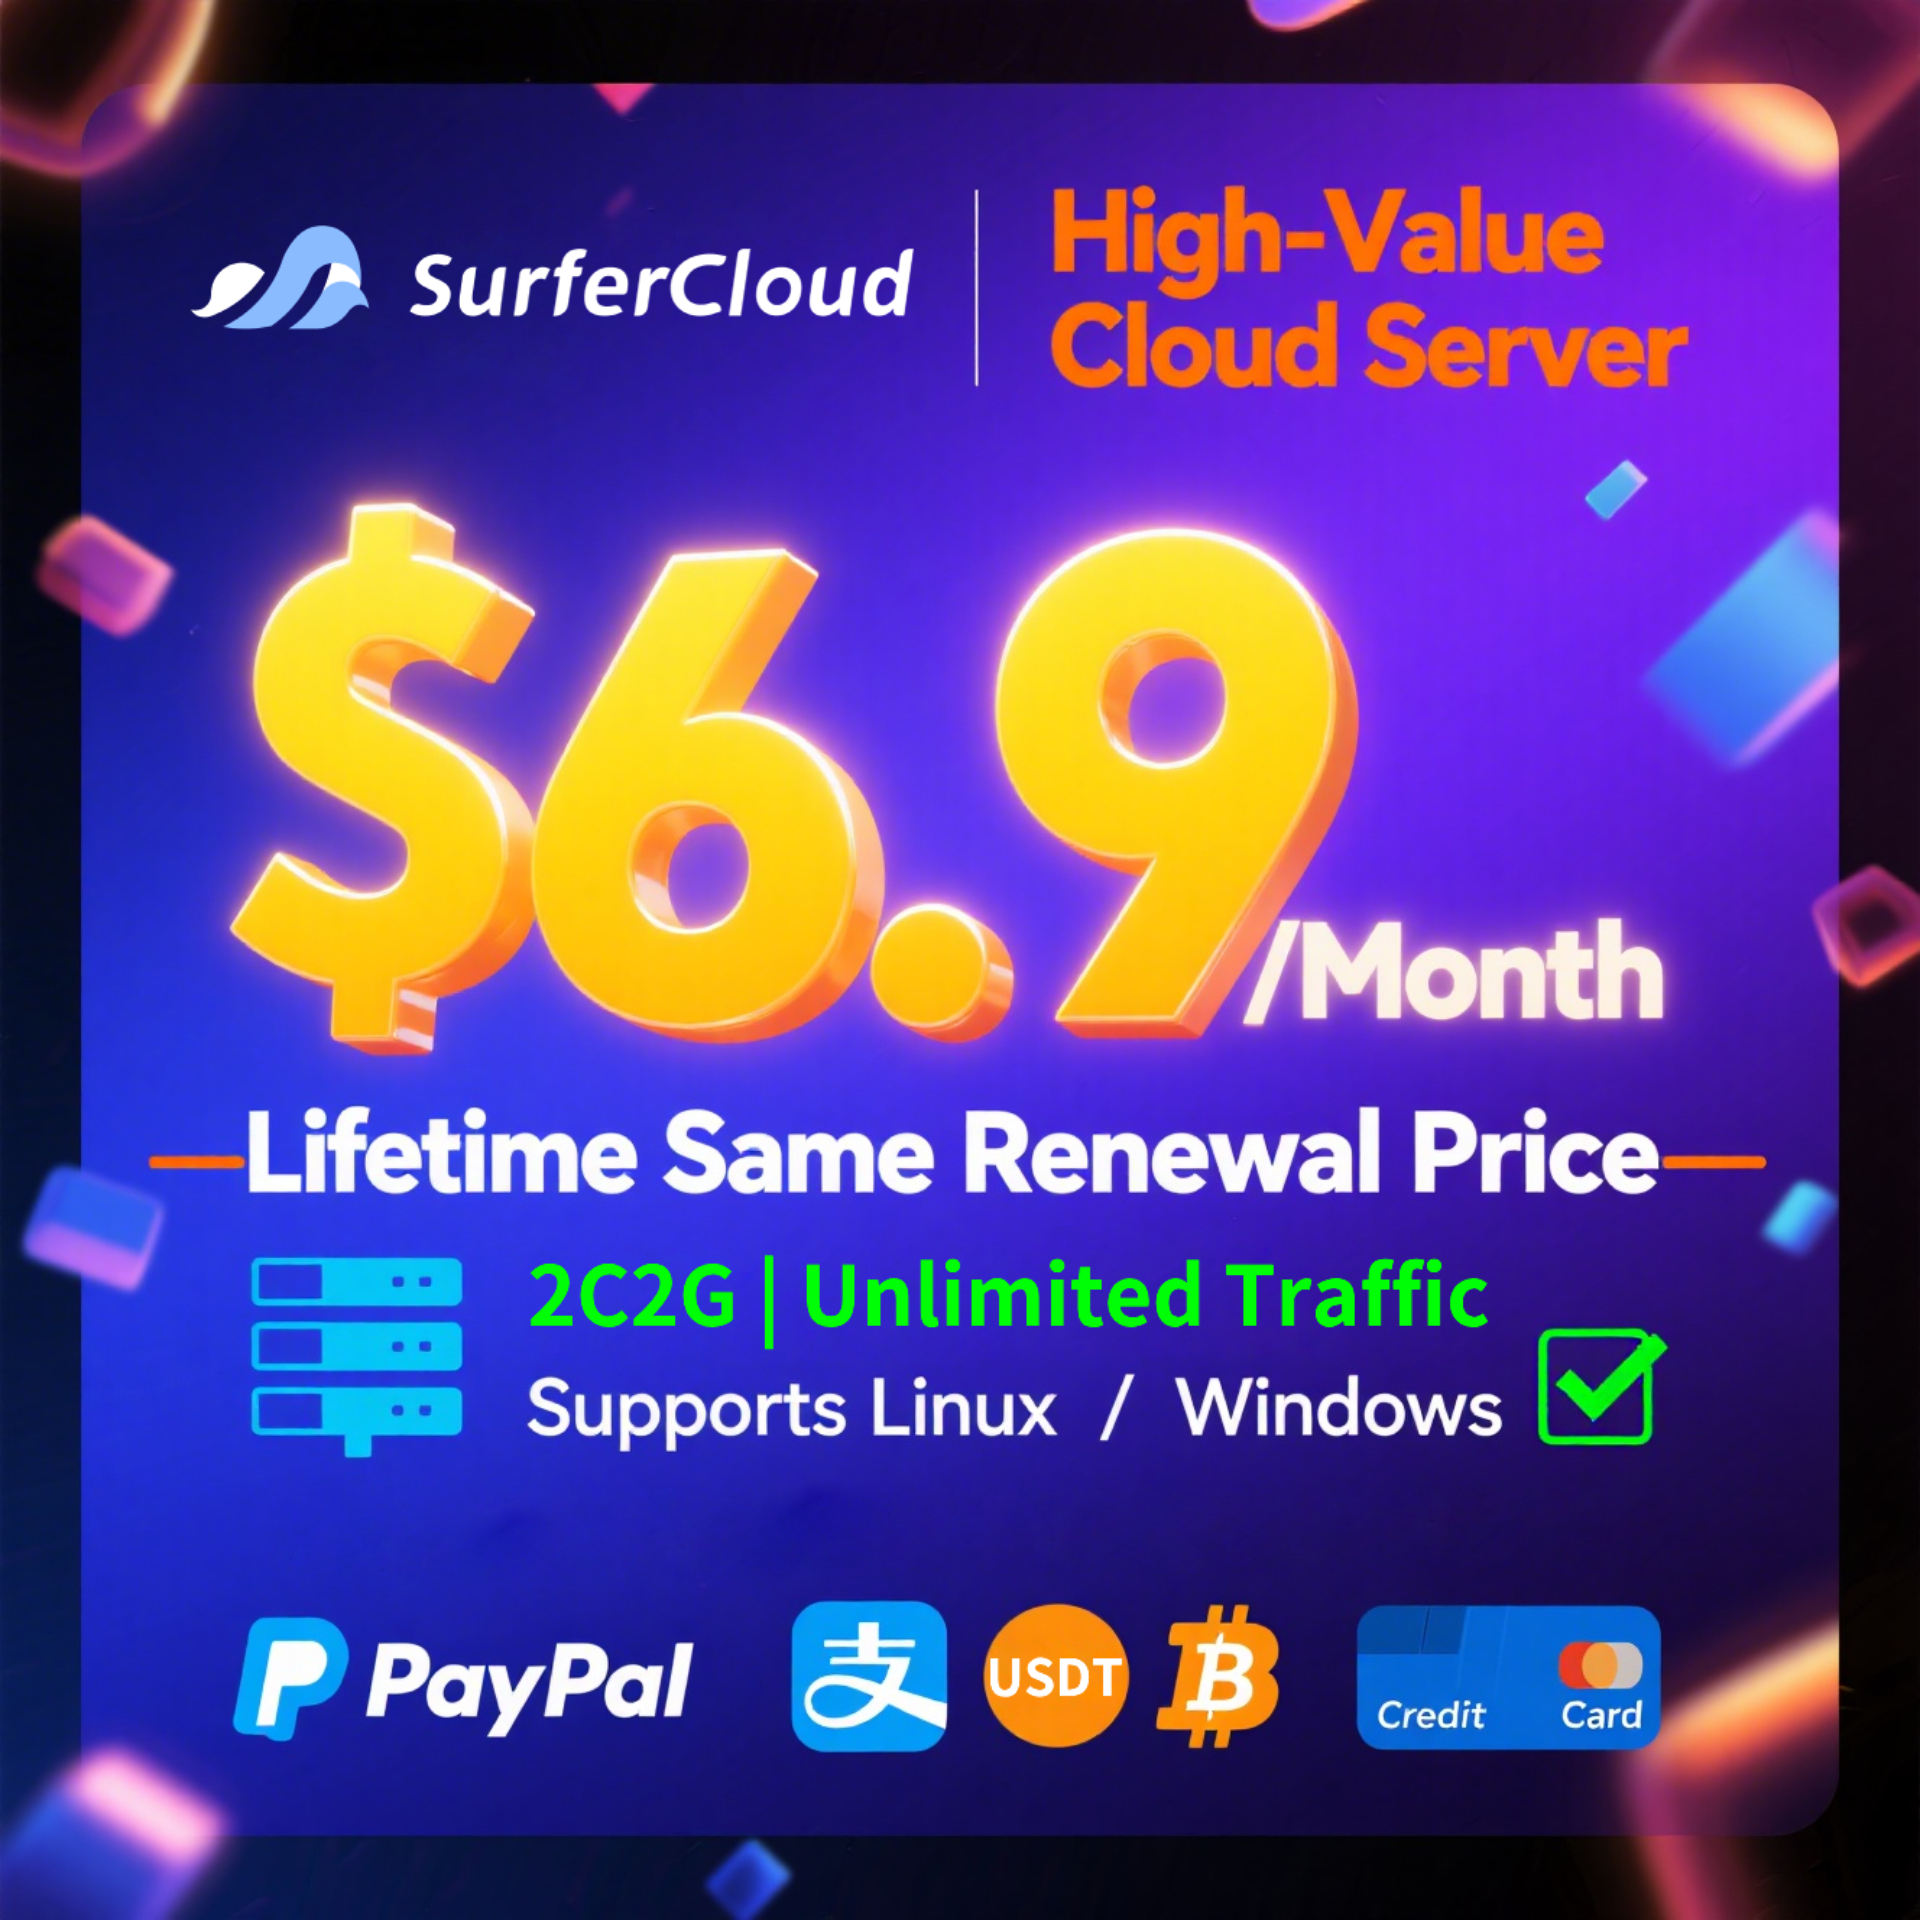
One current example is the ULightHost range on SurferCloud, which starts at $2.9 per month with tiers at $7.5, $12, and $24. The page quotes up to 62% off, 16 data centres, a 10M PPS network, and storage rated at 1.2M IOPS — that last figure is the one to check against your own random-IOPS measurement rather than trusting in isolation. Each plan is limited to one server.
Three terms match the "cannot change after purchase" list above and are worth confirming before you buy. These plans do not support changing region or scaling the configuration up or down, and deleting mid-term refunds pro-rata at the original price rather than the discounted one. They also use machine-room IP addresses with no replacement option, and port 25 is blocked by default.
The pricing is positioned against comparable plans at Vultr, DigitalOcean, and Linode that sit around $12 per month for equivalent specifications — which is the same tier the $12 option occupies here, so the comparison is at least like for like.
How much RAM does a small web application need?
Measure the working set rather than guessing. Sum the resident memory of every process after warm-up, add the database, and leave headroom. A typical small application with a database is comfortable at 2 GB and cramped at 1 GB.
Is shared CPU really a problem?
Only under sustained load. Bursty request handling is exactly what shared cores are good at. Watch the steal time column — if it climbs, another tenant is using your share.
How do I know if my disk is the bottleneck?
Check the IO wait percentage in top and the queue depth with iostat -x 1. High await with low utilisation means the device is saturated.
Is a shared or dedicated bandwidth port better?
Shared for intermittent traffic, dedicated for continuous throughput. The distinguishing question is whether your traffic is bursty or always busy.
What if I choose the wrong tier?
That depends entirely on whether the plan can be resized in place. Check that before buying — it is the difference between a five-minute change and a migration.
Should I buy monthly or longer?
Longer terms carry the discounts, but only commit once the five measurements are stable. Committing before you have data is how people end up paying for a configuration that does not fit.
Buying a server is a measurement problem wearing a shopping decision as a disguise. Collect five numbers — available memory, swap activity, random read latency, peak sustained throughput, and CPU steal time — and the tier selects itself. Skip them, and you will learn the same information through a migration.
The order of importance is not the order on the spec sheet. Memory binds first for most web applications, disk second, and bandwidth and CPU last. Dedicated cores and a dedicated port are worth paying for only when your traffic is continuous; for bursty workloads they are a premium on capacity you will not consume.
Then check the three things that cannot be changed later: whether the configuration resizes, whether the region can be moved, and what leaving early costs. Those are the only parts of the decision that are genuinely irreversible.
If your measurements put you in the first tier, the ULightHost plans cover that case from $2.9 per month. If they show variable load or a need for supporting services, the product comparison page sets out the elastic alternative, and the $1.9 trial plan is the cheapest way to collect the five numbers before committing to a term.
Ever wished you could directly ask questions to a PDF o...

Looking to host pre-trained AI models? The right platfo...
Introduction Internet Information Services (IIS) 8.0...