Run Enterprise Email & Collaboration Plat
Enterprise-grade email and collaboration tools like&nbs...


Edge networking brings data processing closer to devices, reducing delays and improving efficiency. With nearly 30 billion IoT devices expected by 2030, evaluating edge network performance is essential. This guide shows you how to measure metrics like latency, throughput, jitter, and packet loss to optimize network performance under real-world conditions. Key takeaways include:
Start by defining clear metrics, selecting the right tools, and configuring your test environment to ensure your edge infrastructure meets performance goals.
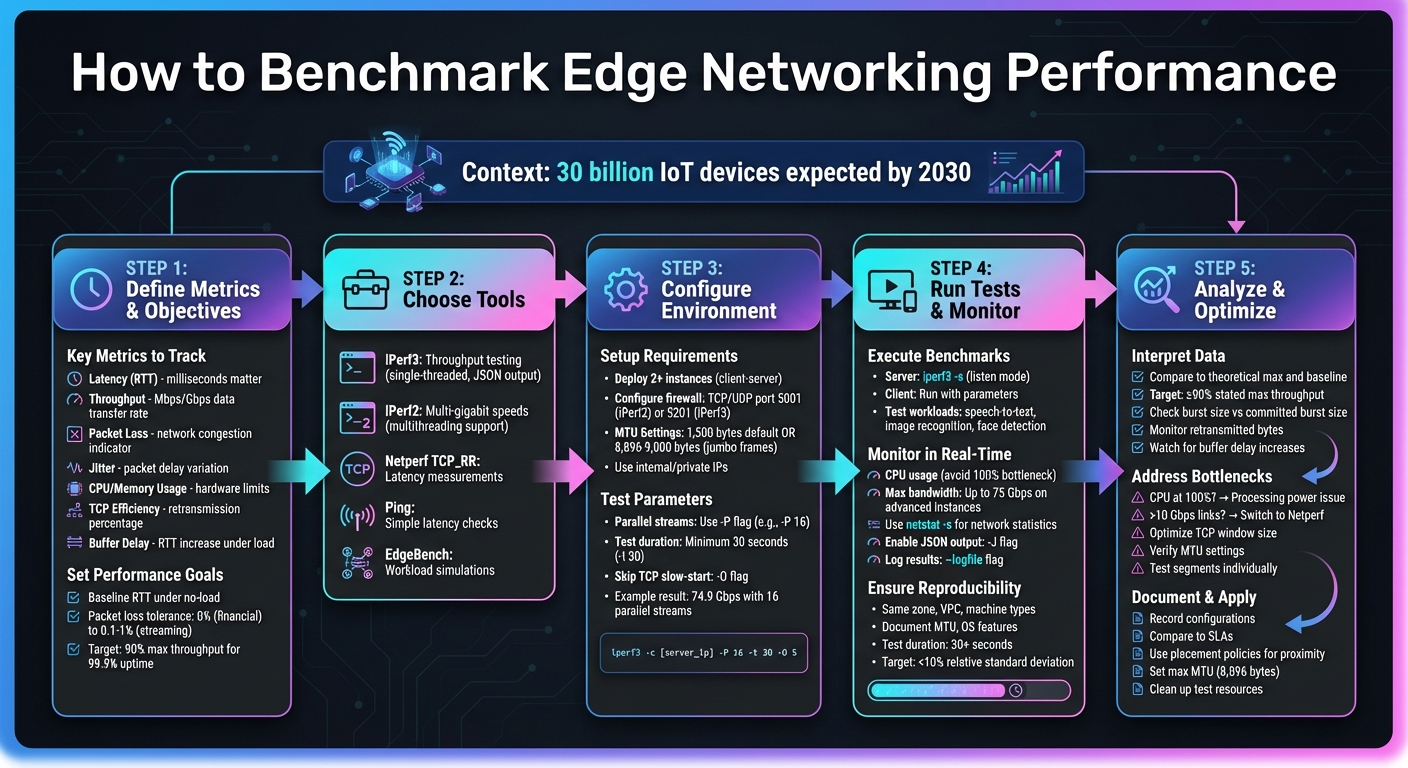
5-Step Edge Network Benchmarking Process with Key Metrics and Tools
When benchmarking, it’s essential to pinpoint the right metrics. Start with latency, also known as Round-Trip Time (RTT). This measures how long it takes for a packet to travel from its source to its destination and back. For applications where every millisecond matters, like gaming or financial trading, latency is a critical metric [6][7].
Next, there’s throughput, which measures the rate of data transfer, typically in Mbps or Gbps. This metric is crucial for data-heavy applications [6][4]. Packet loss, on the other hand, highlights network issues such as congestion or hardware malfunctions. Even minor packet loss can degrade performance significantly [6][7].
Jitter, or Packet Delay Variation, measures inconsistency in packet arrival times. It’s particularly problematic for real-time services like video conferencing or streaming, where smooth delivery is key [6][7]. Beyond these network-specific metrics, keep an eye on CPU and memory usage during tests. If your CPU maxes out at 100%, you’re likely hitting hardware limits rather than evaluating network performance [2][4].
Another key metric is TCP Efficiency, which tracks the percentage of transmitted bytes that don’t require retransmission. A high efficiency score signals a reliable connection [6]. Lastly, consider buffer delay, which measures how much your RTT increases under network load. This can help you identify "bufferbloat", a condition where excessive queuing slows down the entire system [6].
As RFC 7640 explains:
"The primary goal is to assess the maximum forwarding performance deemed to be within the provisioned traffic limits that a network device can sustain without dropping or impairing packets" [6].
These metrics collectively form the backbone of your performance analysis.
Once you’ve defined your metrics, the next step is setting clear, measurable performance goals tailored to your specific needs. For instance, real-time applications like VoIP demand strict limits on jitter and latency, while data-heavy business applications focus more on throughput and TCP efficiency [6].
Establish a baseline RTT under no-load conditions to accurately assess any performance degradation when the network is under stress [6]. Additionally, define your acceptable packet loss tolerance. Some applications, such as financial systems, require zero packet loss (Non Drop Rate), while others, like video streaming, may tolerate a small loss rate of 0.1%–1% (Partial Drop Rate) [8].
For high-bandwidth use cases, you can look to benchmarks like Oracle Cloud Infrastructure’s network SLA, which states that throughput should achieve at least 90% of its maximum capacity for 99.9% of the billing month [4]. Be specific when setting your objectives: include target numbers, test conditions (like frame sizes and transaction intervals), and parallel stream requirements. This level of detail ensures that your results will be both actionable and meaningful.
When it comes to network benchmarking, iPerf stands out as the go-to tool, available in two versions: iPerf2 and iPerf3. The newer iPerf3 has been completely rewritten and includes features like JSON output (-J), which makes automation easier. However, iPerf3 is single-threaded, which can turn into a CPU bottleneck on high-speed links [11]. For environments requiring multi-gigabit speeds, iPerf2 often gets the nod because it supports multithreading, allowing it to make full use of multiple CPU cores [11].
For simpler latency measurements, tools like ping or Netperf's TCP_RR test are excellent options. As Derek Phanekham and Rick Jones pointed out:
"TCP is a more common use case and thus tends to be more representative of real-world applications" [1].
Once you've selected your tools, set up your environment on SurferCloud to mimic realistic edge conditions.

SurferCloud's global network, spanning over 17 data centers, provides a solid platform for edge networking benchmarks. To simulate the edge-cloud continuum and gather realistic latency and throughput data, deploy elastic compute servers in geographically diverse regions [11]. At a minimum, set up two instances - one acting as the server and the other as the client - to replicate client-server interactions. This configuration is ideal for conducting robust edge networking tests.
Proper firewall settings are essential. Configure your VPC firewall to allow inbound TCP/UDP traffic on port 5001 for iPerf2 or port 5201 for iPerf3 [10]. To ensure the best performance, choose instances with advanced virtual NICs and double-check your Maximum Transmission Unit (MTU) settings. While the default Ethernet MTU is 1,500 bytes, enabling jumbo frames (up to 8,896 or 9,000 bytes) can significantly reduce packet overhead and improve throughput [11]. Running tests over internal or private IP addresses is also recommended to avoid the noise and unpredictability of the public internet [5].
With your environment in place, it's time to fine-tune the test parameters for accurate data collection.
For high-speed links, leverage iPerf's -P flag to run multiple parallel streams. This parallelism is crucial for saturating high-speed cloud network adapters [10]. For example, in a test outlined in Google Cloud's January 2026 documentation, the following command was executed:
iperf -t 30 -c [IP] -P 16 This setup, run on a Debian-based system with an MTU of 8,896 and two n2-standard-64 vCPUs, achieved an aggregate bandwidth of 74.9 Gbps [5].
Set a minimum test duration of 30 seconds using the -t flag, and use the -O flag in iPerf3 to skip the TCP slow-start phase [5][10]. When testing over VPNs or IPSec tunnels, which add overhead of 56 to 73 bytes, reduce the MTU to around 1,400 or 1,350 bytes to avoid packet fragmentation [11]. For UDP tests, configure the packet size using the -l flag (ensuring it fits within the path MTU) and adjust the TCP window size with -w for high-latency networks to maintain consistent sender activity [10]. These configurations are directly tied to your performance metrics, ensuring the benchmarks are both relevant and actionable.
With your SurferCloud environment set up, it's time to dive into real-time testing and data collection. Start by creating a client-server architecture within SurferCloud. Run the server in listen mode using iperf3 -s, and initiate tests from the client side with your chosen parameters. To measure download speeds from the server to the client, include the -R flag in your command.
Focus on benchmarks that replicate typical edge workloads, such as speech-to-text, image recognition, face detection, and sensor emulation. A tool like the EdgeBench suite is particularly useful, as it provides pipelines for audio processing, image recognition, and scalar data analysis (e.g., temperature or humidity).
The choice of protocol is a critical factor. While ICMP-based ping tests are common, TCP_RR tests in netperf offer a closer representation of real-world network behavior. Make sure your firewall settings from the setup phase are still in place, allowing ICMP for ping, UDP for throughput tests, and TCP port 5201 for iPerf3 control connections.
For more accurate latency measurements with netperf, use the --enable-spin flag to keep the CPU active during tests. Additionally, using the -A flag in iPerf3 can help bind the process to a specific CPU core, reducing variability in your results.
Once the benchmarks are running, shift your focus to real-time monitoring to ensure accurate results. Tools like top or htop can help you keep an eye on CPU usage on both the client and server. If CPU usage hits 100%, it may limit performance, skewing your results. For high-bandwidth tests on advanced SurferCloud instances, configurations like n2-standard-64 with Tier_1 networking can achieve egress bandwidths of up to 75 Gbps [3].
Use netstat -s before and after the tests to capture network statistics and identify any errors or protocol-level issues. To streamline data collection, enable iPerf3's -J flag for JSON output, and use the --logfile flag to save results to persistent storage for later analysis.
Before diving into your results, double-check key environmental factors. Verify Maximum Transmission Unit (MTU) settings with ifconfig and ensure your VM's performance tiers match expectations using your cloud provider's CLI tools. For more detailed troubleshooting, use tcpdump with a snaplen of 128 to capture packet-level data [2].
Consistency is critical for reliable benchmarking. Deploy test instances in the same zone, on the same VPC, and with identical machine types to minimize variability. Document fixed parameters like MTU settings (e.g., 8,896 bytes for high-bandwidth tests) and any relevant guest OS features.
Align transaction intervals across tools for accurate comparisons. For instance, when Google researchers synchronized ping and netperf intervals to 10ms, they reduced latency discrepancies from 80 microseconds to just 13 microseconds [1]. Set test durations to at least 30 seconds to allow TCP to reach maximum throughput, and use the -O flag in iPerf3 to skip the initial TCP slow-start phase.
To validate your results statistically, run enough iterations to keep the relative standard deviation under 10% - a widely accepted threshold for repeatability in data center and edge environments [9]. Document all test parameters, including tool versions, command-line flags, iteration counts, and instance placement policies, to ensure reproducibility. Finally, consider automating your infrastructure setup with tools like Terraform or Ansible to maintain consistent configurations across all test runs.
Start by comparing your benchmark metrics to theoretical maximums and baseline values. For throughput tests, align your results with the link speed and VM SKU limits. For latency, compare against a non-congested baseline round-trip time (RTT). In many cloud environments, network performance is often considered acceptable if it achieves at least 90% of the stated maximum throughput during most of the billing cycle[4].
If the Burst Size Achieved is lower than the Committed Burst Size, your device might struggle with traffic bursts, leading to packet loss[6]. Similarly, a high volume of retransmitted bytes can signal network congestion or packet loss[6]. Keep an eye on buffer delay increases, as they often point to network congestion[6].
Be alert for anomalies like negative packet delays or a high count of out-of-order packets, as these can indicate synchronization or load-balancing issues[6][2]. Also, remember that localhost response times are typically about 10 times faster than those of remote systems[12], so avoid direct comparisons between them.
Once you've analyzed the data, shift your focus to identifying and resolving performance bottlenecks.
If your CPU usage hits 100%, the issue lies with processing power rather than network capacity[2]. For high-speed links exceeding 10 Gbps, consider switching to Netperf, which avoids iPerf3's single-threading limitations[2].
To optimize throughput, adjust the TCP window size and verify your MTU settings to prevent packet fragmentation[3][5]. For example, use the -w switch in iPerf, or on Windows systems, run Set-NetTCPSetting -AutoTuningLevelLocal Experimental to fine-tune throughput.
A "divide and conquer" approach can be particularly effective. Test individual network segments - such as Cloud-to-Edge and Edge-to-On-Prem - to isolate bottlenecks. This helps determine whether the issue lies within your cloud provider's network, the WAN, or your corporate network[13].
Once you've addressed the bottlenecks, take the time to document your findings and the changes you made. Record all configuration details, compare your results to service-level agreements (SLAs), and list the optimizations applied. Don’t forget to clean up benchmarking resources immediately to avoid unnecessary costs.
For workloads sensitive to proximity, use instance placement policies in SurferCloud to ensure VMs are located in the same zone, minimizing micro-latency[1]. Additionally, configure your Virtual Private Cloud (VPC) and guest operating system to use the maximum supported MTU (e.g., 8,896 bytes for high-bandwidth setups) to maximize egress bandwidth[3][5]. If you're testing proxies like Envoy, consider disabling circuit breaking limits and unnecessary stat generation to avoid artificial queuing[14].
Finally, delete any test VMs, specialized networks, and custom images from your SurferCloud account. Document the optimizations you applied and their impact on performance. This will serve as a valuable resource for future performance tuning.
When it comes to benchmarking edge networking, success starts with defining clear metrics and applying practical optimizations. The tools you choose matter - a lot. For example:
Keep in mind, tool settings can skew latency measurements by more than 100% if not configured carefully [1].
Your infrastructure setup plays a huge role in performance outcomes. High-performance VM instances equipped with features like Tier_1 networking can achieve up to 75 Gbps in maximum egress bandwidth [3][5]. To hit these numbers, focus on optimal MTU settings and ensure your CPUs aren’t becoming bottlenecks [2]. As experts Derek Phanekham and Rick Jones point out:
"TCP is a more common use case and thus tends to be more representative of real-world applications" [1].
This means TCP-based tests should take priority over ICMP when you're assessing latency for production workloads.
Benchmarking is especially valuable during performance analysis. For instance, meeting SLA requirements - like maintaining at least 90% of the maximum throughput for 99.9% of the billing month - is a key performance indicator [4]. Comparing your results to these benchmarks can help pinpoint whether issues stem from network capacity, CPU limitations, or misconfigured settings. Don’t forget to clean up test resources afterward to avoid unnecessary charges [3][5].
These insights provide a solid foundation for actionable improvements.
Now that you have your benchmarks, it’s time to put them to work. Start by implementing your testing strategy with SurferCloud's global infrastructure. With over 17 data centers worldwide, you can test edge performance across multiple regions to ensure your deployment meets latency and throughput goals. For workloads requiring microsecond-level latency, use SurferCloud's instance placement policies to position VMs in close physical proximity [1].
Maximize your network’s potential by configuring your VPC with the highest supported MTU and leveraging advanced networking tiers for greater bandwidth. Document your baseline metrics and schedule regular tests to catch and resolve performance issues early. This proactive approach will help you maintain a reliable, high-performing distributed infrastructure.
When evaluating edge networking performance, it's essential to consider four key metrics that reveal how well your network is functioning:
By analyzing these metrics, you gain a clear picture of your network's performance and can pinpoint areas needing improvement to keep your edge solutions running smoothly.
To make sure your edge networking benchmarks are both accurate and repeatable, start by creating a standardized test environment. Use identical virtual machine setups with consistent configurations - this includes the same operating system version and network interface settings. Lock down runtime parameters, such as concurrency levels, and disable features like auto-throttling that might introduce variability into your results.
For reliable measurements, tools like ping, iperf3, or netperf are excellent choices. Automating the benchmarking process with scripts or dedicated tools can help ensure consistency across multiple test runs. Be thorough in documenting all variables - this includes details like VM types, network setups, and specific test commands - so others can replicate your process without confusion. Finally, run multiple iterations of each test and analyze the data using averages and standard deviations. This approach will make your results more reliable and meaningful.
To get a clear picture of edge network performance, there are several go-to tools known for their precision and flexibility:
Together, these tools help you assess critical metrics like latency, throughput, jitter, and packet loss, making them indispensable for evaluating edge network solutions.


