Ubuntu, CentOS, or Rocky? Selecting the Perfe
A cloud server is only as good as the operating system ...


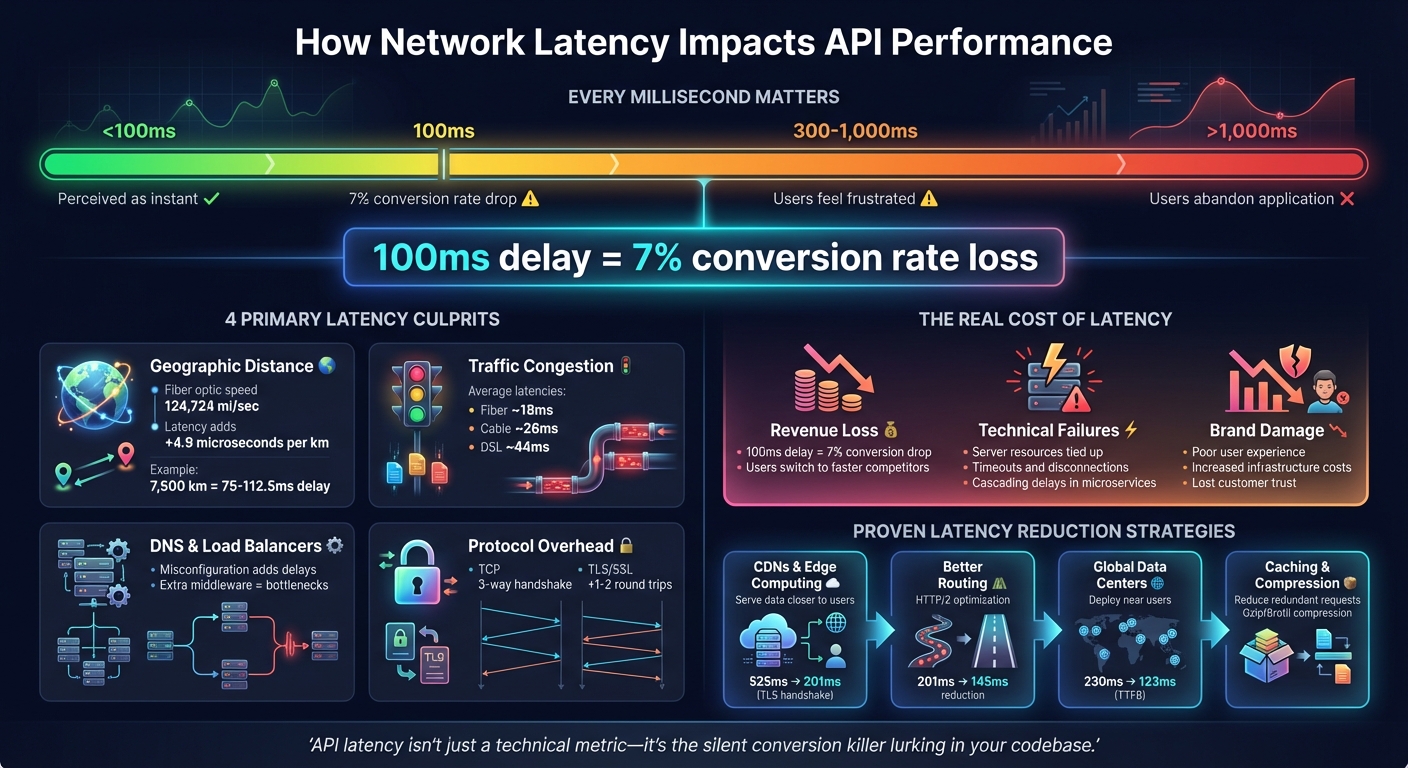
Network latency - the delay in data transmission between a client and server - can significantly impact API performance. Even slight delays measured in milliseconds can frustrate users, disrupt applications, and hurt business outcomes. Here's why it matters and what you can do about it:
Reducing latency isn't just about technical fixes - it's about delivering faster, smoother experiences that keep users engaged and businesses competitive.
How Network Latency Impacts API Performance and User Behavior
Network latency can slow down applications and create a ripple effect of system issues. Grasping these impacts is essential to focus your efforts on the right optimization strategies.
Delays under 100ms are usually perceived as instant, but when they stretch to 300–1,000ms, users begin to feel frustrated. Anything over 1,000ms often results in users abandoning the application altogether [7][8]. To put it into perspective, even a 100ms delay in an API's response time can slash conversion rates by about 7% [7][8].
"Slow APIs kill user experience. When milliseconds separate you from your competitors, laggy API responses send users running straight to alternatives." - Zuplo Learning Center [7]
Mobile users face even greater challenges due to fluctuating connection quality and battery-saving optimizations, which can further exacerbate delays [7][8].
But the problem doesn't stop at user dissatisfaction - these delays also wreak havoc on system performance.
Latency issues do more than annoy users - they can cripple system functionality. Long delays tie up critical server resources, leaving fewer available to handle incoming requests [8][6]. If a request takes too long to process, clients may time out and disconnect before receiving the data [10].
In microservices architectures, latency can snowball. Sequential service calls mean delays in one service can cascade, causing dependent services to wait indefinitely for responses [8][2]. Over time, this can overwhelm buffers and lead to transaction failures [10]. These kinds of technical disruptions directly undermine API performance and reliability.
And the consequences don’t stop there - they extend into the business realm.
The financial toll of high latency is hard to ignore. Slow APIs drive users away, resulting in lost engagement and revenue. When APIs fail to meet responsiveness expectations, it’s not just a technical issue - it’s a business problem.
"API latency isn't just a technical metric - it's the silent conversion killer lurking in your codebase." - Zuplo Learning Center [7]
In some cases, companies respond to latency by pouring money into additional bandwidth, only to find that it doesn’t address the root problem. This can lead to ballooning infrastructure costs without any real performance gains [11]. In competitive markets, where every millisecond counts, even minor delays can push users toward faster alternatives [7].
Network latency arises from various factors that slow down the response time of APIs. Let’s break down the main contributors to latency.
One of the primary causes of latency is the physical distance data packets must travel. When data moves across long distances - whether through cables or wireless networks - delays are unavoidable. For instance, in fiber-optic cables, light travels at about 124,724 miles per second (200,000 km/s). This means every kilometer adds around 4.9 microseconds of delay[1][9]. A 7,500 km connection, for example, can introduce approximately 75 to 112.5 milliseconds of delay[9].
The quality of the network infrastructure also plays a significant role. Factors like the condition of fiber-optic links and the efficiency of network equipment impact transmission speeds. A user in Germany accessing a nearby server might experience just 1 millisecond of latency, but connecting to a server in the United States could result in a minimum Time to First Byte of around 123 milliseconds[9].
Congestion occurs when the volume of data exceeds the capacity of a network path. This leads to queuing delays, as packets are held in buffers until routers can process them. Additionally, packets often pass through multiple routers - referred to as "hops" - on their way to the destination[8]. Each hop adds processing time, and inefficient routing can send packets on unnecessary detours, increasing delays[6].
The type of internet connection also influences latency. During busy times, fiber-to-the-home connections average about 18 milliseconds of latency, cable connections around 26 milliseconds, and DSL roughly 44 milliseconds. For example, while the ideal round-trip time between New York and Sydney via fiber might be 160 milliseconds, real-world measurements often fall between 200 and 300 milliseconds due to routing inefficiencies, processing delays, and congestion[14].
Delays can also occur during DNS lookups, which are required to resolve domain names into IP addresses[8].
Load balancers and proxies, although designed to distribute traffic efficiently, can add to latency if misconfigured or overloaded. For example, extra middleware layers - such as authentication proxies or API gateways - may introduce processing bottlenecks. However, optimized load balancing can significantly improve performance. A study comparing load balancer configurations found that routing through the nearest edge location reduced the Time to First Byte for a user in Germany accessing a US-Central server from 230 milliseconds to 123 milliseconds[9].
Communication protocols themselves can contribute to delays. For instance, TCP requires a three-way handshake before data transmission begins, and encryption protocols like TLS/SSL add 1–2 additional round trips to set up secure connections[9][12]. These delays become more pronounced over greater distances, as each handshake involves multiple round trips[13].
You can't fix what you don't measure. To tackle latency issues effectively, you need tools that can distinguish between network delays and server-side processing problems.
Synthetic monitoring uses automated probes deployed across various global locations to test performance on a schedule. These probes help establish performance benchmarks and detect regional routing inefficiencies before users feel the impact [8] [3]. For instance, synthetic monitoring might reveal that users in one region consistently experience higher latency than others, pointing to potential routing problems.
Real User Monitoring (RUM), on the other hand, captures actual user latency data across different devices and networks [8]. Unlike synthetic monitoring, RUM provides insight into how performance varies by device, browser, or internet service provider. Distributed tracing tools, such as Jaeger, Zipkin, and OpenTelemetry, can trace requests across microservices to pinpoint specific delays [15] [2].
For quick insights, browser DevTools are invaluable. The "Network" tab in Chrome or Firefox, for example, shows "Waiting (TTFB)" for each API request [2] [8]. Continuous profilers like Datadog's wallclock profiler can also help identify off-CPU latency - delays caused by waiting for resources or garbage collection stalls [16].
Once your monitoring setup is in place, focus on collecting and analyzing key latency metrics to identify bottlenecks.
With monitoring tools in place, specific metrics can reveal where your performance issues lie.
Time to First Byte (TTFB) measures the time between sending a request and receiving the first byte of the response. This metric reflects both the time spent in network transit and the server's initial processing delay [15] [2]. Round Trip Time (RTT), meanwhile, tracks the time it takes for a signal to travel from the client to the server and back, offering insight into the efficiency of the network path [1] [4].
To spot performance issues affecting a minority of users, track P95 and P99 percentiles. These percentiles highlight the slowest 5% and 1% of user experiences, which averages often obscure. Research shows that latency above 100 ms starts to feel sluggish, and delays over 300 ms can significantly hurt user satisfaction [15]. In fact, every additional 100 ms of latency can reduce conversion rates by up to 7% [8].
Breaking latency into its components - like DNS lookup, TCP connection, and SSL/TLS handshake - can help pinpoint where delays occur, even before requests reach your server [15] [2]. Setting latency budgets, such as 20 ms for the gateway and 100 ms for the database, ensures performance standards are met across your system [15].
| Component | What It Measures | Diagnostic Value |
|---|---|---|
| DNS Lookup | Time to resolve domain to IP | Identifies slow DNS resolution or caching issues |
| TCP Handshake | Time to establish connection | Highlights network congestion or distance-related delays |
| SSL/TLS Handshake | Time for secure encryption setup | Points to unoptimized certificate or protocol settings |
| Server Processing | Time executing backend logic | Isolates inefficient code or slow database queries |
| Content Transfer | Time to deliver the full payload | Reveals issues with large payloads or limited bandwidth |
These metrics provide actionable insights to help optimize performance and maintain smooth API responses.
For a quick way to measure TTFB, use this command in your terminal:
curl -o /dev/null -s -w "TTFB: %{time_starttransfer}n" [URL] Once you've pinpointed where latency is happening, the next step is to take action. The strategies below tackle common bottlenecks and can make an immediate difference in reducing delays.
Content Delivery Networks (CDNs) store copies of your content across multiple locations, called points of presence (PoPs), around the globe. This setup ensures that users receive data from the server closest to them, cutting down on travel time [8] [17]. Many modern CDNs also handle SSL offloading, meaning they manage SSL/TLS sessions at the network's edge rather than at the origin server. This reduces the number of round trips needed for secure connections. For example, tests showed that this approach reduced TLS handshake latency for a user in Germany from 525 ms to 201 ms [9]. Additionally, edge nodes maintain persistent connections to backend servers, bypassing the need for repeated TCP handshakes [4] [9].
Edge computing takes things a step further by processing data and application logic at the network's edge instead of relying on a centralized data center. This can bring wait times down from hundreds of milliseconds to just a few [6]. For instance, live streaming platforms have seen significant latency reductions by using distributed infrastructures.
Next, focus on optimizing how data travels through the network with better routing and DNS configurations.
The path data takes is just as important as the physical distance it travels. Reducing the number of network hops - how many routers data passes through - can significantly cut delays. Upgrading to modern protocols like HTTP/2 and HTTP/3 helps here by enabling connection multiplexing and reducing handshake overhead. Persistent connections (keep-alive) also eliminate the need to repeat the TCP handshake for every request [8] [9]. In one case, switching from standard HTTPS to HTTP/2 reduced latency for a user in Germany from 201 ms to 145 ms [9].
DNS optimization is another key step. Faster DNS resolution - achieved through advanced DNS providers, shorter TTL values for dynamic content, or DNS prefetching - ensures domain-to-IP lookups don't slow things down.
Placing resources closer to users with global data centers can further reduce delays.
The idea is straightforward: position your servers near your users. Deploying API servers across multiple regions ensures users connect to the closest available instance, minimizing baseline latency [8] [9]. For example, using an external application load balancer with edge proxying reduced the Time to First Byte (TTFB) for trans-Atlantic requests from 230 ms to 123 ms [9].
SurferCloud's network of 17+ global data centers offers this advantage, allowing businesses to strategically place their infrastructure near their users. This not only reduces latency but also provides failover routing. If one regional data center encounters issues, traffic is seamlessly redirected to the next closest healthy location.
Caching at multiple levels can significantly cut down on redundant processing and database queries. This includes client-side caching, server-side caching with tools like Redis, and edge caching, all working together to deliver faster responses [6] [8].
Optimizing payloads is equally critical. Using Gzip or Brotli compression can shrink the size of transmitted data [5] [8]. Switching to efficient data formats like Protocol Buffers instead of JSON can also reduce payload sizes. Additionally, techniques like code minification can speed up load times [8] [17].
Connection pooling is another effective method. By maintaining a pool of open database connections, you avoid the overhead of establishing new connections for every API request [6]. When combined with compression and caching, these strategies ensure data moves through the network as efficiently as possible.
SurferCloud takes API performance seriously, offering tailored solutions that prioritize speed and reliability. By combining smart data center placement, optimized routing, and expert support, their global cloud platform ensures consistently low latency.
SurferCloud boasts a network of 17+ data centers across four continents, strategically placed to bring API servers closer to users. These locations include major hubs like Los Angeles, Washington, Frankfurt, London, Dubai, Tokyo, Singapore, Hong Kong, and Mumbai. This setup ensures users in regions like Southeast Asia (via Singapore) or Europe (via Frankfurt) experience faster, localized service.
All data centers adhere to Tier 3 standards, guaranteeing 99.95% availability [18]. With optimized routing that minimizes network hops, this infrastructure keeps response times low, even during high traffic periods. Plus, with elastic compute servers (UHost) that can be deployed in minutes, businesses can scale globally without compromising on speed or reliability.
This strong foundation works seamlessly with SurferCloud's advanced networking tools to further improve API performance.
SurferCloud's UCDN (Content Delivery Network) plays a crucial role in reducing delays by caching static content and API responses at edge locations. By balancing traffic loads, UCDN ensures smoother performance. Dedicated bandwidth options, ranging from 1 to 10,000 Mbps, eliminate the risk of shared resource slowdowns, also known as the "noisy neighbor" issue [18].
For businesses leveraging hybrid or multi-cloud setups, SurferCloud supports direct connect and VPN options, enabling smooth integration between dedicated servers and cloud instances. Security features like DDoS protection and host intrusion detection add an extra layer of defense, preventing malicious traffic from causing latency spikes.
Reliable infrastructure is only part of the equation - proactive, around-the-clock support ensures everything runs smoothly. SurferCloud offers 24/7 support via Telegram, WhatsApp, and support tickets, so help is always available when you need it. Their teams assist businesses in selecting the best combination of elastic compute, dedicated servers, or hybrid models to match API workload demands.
"Gotta say, the support from SurferCloud is great. Had a few questions about my Cloud Server, and they got back to me fast, sorting everything out smoothly each time." - Jose Lucas [18]
To help businesses choose the ideal deployment location, SurferCloud provides a speed test tool covering all 17+ data centers. For critical APIs, their engineers can design geo-redundant architectures that distribute workloads across multiple nodes. This approach minimizes the impact of regional outages and ensures consistent performance, no matter where users are located.
Network latency goes beyond being a simple technical concern - it's a crucial element that shapes user experience, influences conversion rates, and directly affects revenue. To put it into perspective, even a slight delay of 100ms can lead to a 7% drop in conversions[8]. Identifying the root causes - whether it's routing issues, DNS inefficiencies, or server processing delays - is key to addressing the problem.
Tackling latency requires a multi-pronged approach. This includes placing servers closer to users, utilizing CDNs and edge computing, optimizing protocols like HTTP/2 and HTTP/3, and closely tracking p95 and p99 latency metrics[6][8]. Modern applications often aim for API latency under 100ms, a benchmark that demands thoughtful infrastructure planning and consistent performance monitoring[8]. These efforts don't just enhance technical performance - they bring tangible business gains.
As Farouk Ben, a performance expert at Odown, aptly puts it:
"API latency isn't just a technical consideration - it directly impacts business outcomes." [8]
SurferCloud's robust global infrastructure and dedicated 24/7 support empower businesses to tackle latency issues and fine-tune API performance. This blend of advanced technology and reliable support highlights how critical low latency is for maintaining a competitive edge.
To measure and keep an eye on network latency effectively, start by focusing on essential metrics such as round-trip time (RTT), server processing time, and throughput. Together, these metrics give you a clear picture of how latency impacts performance. Make sure both the client and server are set up to capture accurate timestamps, so you can calculate queue times and service times with precision.
A monitoring platform, like the tools offered by SurferCloud, can help you gather these metrics and display latency trends based on endpoint, region, or time of day. Establish practical thresholds - such as keeping RTT below 200 milliseconds for critical APIs - and set up alerts to flag any ongoing issues. Running synthetic probes from various geographic locations is another smart move. These tests can uncover location-based latency problems, enabling you to fine-tune performance with strategies like edge caching or load balancing.
Make it a habit to review latency reports regularly. Look for trends, uncover recurring issues, and adjust your infrastructure as needed to keep APIs fast and dependable for users across the U.S.
Reducing API latency in microservices calls for a mix of careful monitoring, targeted optimizations, and thoughtful system design. Start by measuring latency throughout your system to pinpoint bottlenecks and set up alerts to catch performance issues early.
One effective strategy is caching. By using in-memory caches or edge caches, you can store frequently accessed data, cutting down on repeated database or service calls and shaving off valuable milliseconds from response times.
Database performance is another critical area. Speed up queries by rewriting inefficient ones, adding indexes, or batching operations to reduce overhead. Placing services closer to each other - whether in the same region or through globally distributed infrastructure like SurferCloud's network - can further minimize round-trip times.
Load balancing and intelligent traffic routing also play a key role in distributing requests efficiently, preventing delays during peak usage. On the protocol side, lightweight options like gRPC or compressed JSON can accelerate data exchanges. For APIs handling long-running tasks, asynchronous processing helps by offloading those tasks, allowing the system to respond more quickly to incoming requests.
By combining these techniques, you can build APIs that maintain strong performance, even under heavy loads.
When a user is located far from the server hosting your API, the time it takes for data to travel between them increases. This extra geographic distance results in higher network latency, which can slow down how quickly your API responds.
To ensure smoother performance, reducing this delay is key. Deploying servers closer to your users - like those offered by global cloud providers - can help cut down latency and deliver a faster, more seamless experience.


