Optimize Your Website: A Complete Guide to CD
Monitoring the performance of your Content Delivery Net...


Slow CI/CD pipelines waste time and resources. Fixing them is simpler than you think.
Here’s how you can make your pipelines faster:
Faster pipelines mean quicker deployments, better feedback, and less frustration. Start by auditing your current setup, then apply these techniques to see immediate improvements.
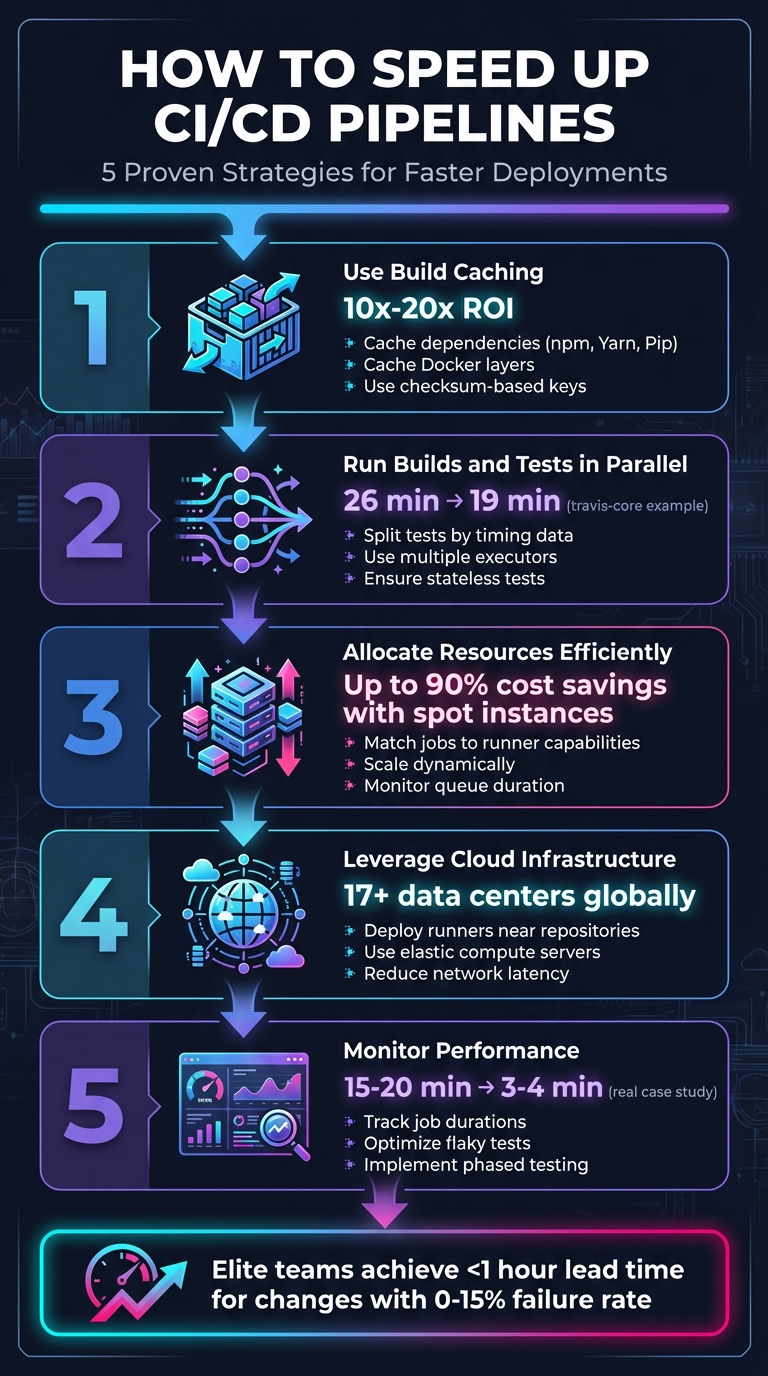
5 Key Strategies to Speed Up CI/CD Pipelines
Build caching is a smart way to cut down on repetitive tasks during builds. Instead of starting from scratch every time, the pipeline looks for a cached version tied to a unique key. If it finds one, it downloads and extracts it, saving time and effort. This method can yield a 10x–20x return on investment [5][8].
The secret to effective caching lies in using checksum-based keys. These keys are created by hashing files like package-lock.json or Gemfile.lock. When those files change, the checksum changes too, which signals the pipeline to invalidate the old cache and generate a new one. A good starting point is caching dependencies to speed up package retrieval.
Caching dependencies for tools like npm, Yarn, Pip, and Bundler can drastically reduce build times. Instead of downloading the entire dependency tree, the system fetches only new or updated packages from the cache. This is especially useful for projects with a large number of dependencies.
To improve cache hit rates, set up fallback keys. These keys act as a backup plan - if the system doesn’t find an exact match, it can fall back to a broader key, such as one tied to a specific branch, for a partial restore. However, keep in mind that GitHub Actions automatically removes caches not accessed in over 7 days and enforces a 10 GB cache size limit per repository [9].
Docker builds can benefit greatly from layer caching. If a specific layer hasn’t changed, Docker reuses it from the cache, skipping the rebuild process. However, if one layer changes, all subsequent layers must be rebuilt.
"Reusing layers from the cache speeds up the build process because Docker doesn't have to rebuild the layer again." - Docker Documentation [6]
To make the most of this, optimize your Dockerfile order. Place commands that rarely change, like installing OS packages or dependencies, at the top. Save commands that change frequently, such as copying source code, for the end. You can also use RUN --mount=type=cache to create persistent directories for package managers, allowing incremental updates across builds. Finally, include a .dockerignore file to exclude unnecessary files (e.g., logs or local node_modules) that might accidentally invalidate the cache.
Speeding up your CI/CD workflow doesn’t stop at caching - it gets a major boost from running builds and tests in parallel. By executing tests at the same time across multiple executors - like containers or virtual machines - you can significantly cut down pipeline duration. This approach, known as horizontal scaling, allows you to expand test coverage without dragging out the testing phase [11][3].
Parallel execution works by intelligently splitting tests across multiple executors. Splitting can be done by name, file size, or, most effectively, by timing. Timing-based splitting uses historical data to group tests so that each parallel node finishes at roughly the same time. This method avoids bottlenecks caused by one long-running test holding up the entire process [11][2]. For example, implementing parallelization across four jobs reduced the test suite duration for travis-core from 26 minutes to 19 minutes [12].
To make parallel execution work seamlessly, it’s important that your tests are stateless and independent - this ensures they can run simultaneously without interfering with one another [13]. However, keep an eye on your environment's spin-up time. If setting up a container takes as long as running the test itself, excessive parallelism might actually slow things down [2]. Additionally, uploading test results in JUnit XML format allows CI tools to parse timing data, making it easier to optimize future runs [11].
Breaking your test suite into parallel suites is easier than it sounds, especially once you choose the right splitting method. Here’s a quick comparison of the main approaches:
| Splitting Method | How It Works | Efficiency |
|---|---|---|
| By Name | Divides test files alphabetically. | Low; doesn’t account for varying test durations. |
| By Size | Splits based on file size. | Medium |
| By Timing | Balances workloads using historical execution data. | High; ensures all nodes finish simultaneously. |
Most CI platforms simplify this process by using environment variables like $CIRCLE_NODE_TOTAL (total executors) and $CIRCLE_NODE_INDEX (current executor index) to automatically distribute tests across nodes [11]. This automation eliminates the need for manual test splitting, creating a faster feedback loop that helps developers catch problems early and speeds up release cycles [12].
Parallel execution pairs perfectly with incremental builds to further streamline your workflow. Incremental builds focus only on rebuilding components that have changed, skipping over unaffected parts of the application [13][14]. Tools like nx affected can identify and run tests related to specific code changes in a pull request, reducing unnecessary work. This targeted strategy, combined with parallel execution, can dramatically shorten pipeline times while maintaining full test coverage, keeping your team efficient and responsive.
To get the most out of your compute resources, strike a balance between performance and cost. Overprovisioning can drain your budget, while underprovisioning risks slowing down your pipelines. The key is to align your infrastructure with actual workload patterns - scaling up during peak demand and scaling down during quieter periods.
Effective resource allocation starts with understanding the specific needs of each job. For example, a simple lint check doesn’t require the same level of resources as a full integration test suite. By analyzing the requirements of each task, you can ensure lightweight jobs aren’t running on unnecessarily powerful (and expensive) runners. This kind of upfront planning helps avoid waste and keeps your processes efficient.
Monitoring is another crucial element. Keep an eye on metrics like job queue duration (e.g., gitlab_runner_job_queue_duration_seconds) to identify potential bottlenecks. This data can differentiate between issues caused by capacity constraints and those stemming from hardware performance. When done right, these strategies enable dynamic scaling and precise sizing of your runners.
Dynamic scaling with spot instances is a cost-effective way to handle fluctuating workloads. Spot instances can slash costs by up to 90% compared to on-demand pricing[15]. Since CI/CD workloads are usually stateless and fault-tolerant, they’re an excellent match for this approach.
However, spot instances come with a catch - they can be reclaimed by the provider with just a two-minute warning[15][16]. To navigate this, implement termination handlers that gracefully drain workloads before shutdown. Razorpay’s engineering team showcased the potential of this approach in April 2023, running their staging environment entirely on spot instances and achieving 60% spot instance usage in production[16].
"AWS recently introduced a spot allocation strategy called 'price-capacity-optimized' which makes spot allocation decisions based on both capacity availability and Spot prices. We use this allocation strategy to optimize cost savings, Spot capacity availability, and interruption rates." – Nijil Raj, Lead DevOps Engineer, Razorpay[16]
To keep pipelines running smoothly, even when spot capacity runs out, diversify your setup. Use multiple instance types (like C5, M5, or C6a) across different availability zones. Build fallback mechanisms to switch to on-demand instances automatically if spot instances aren’t available[16][17]. Additionally, configure parameters like IdleCount and IdleTime to maintain a small buffer of standby runners. This ensures jobs can start immediately while scaling down unused capacity during downtime[17].
Properly sizing your runners is essential for avoiding wasted resources and ensuring smooth operations. Use resource classes or specific configuration keywords to define the compute power each job requires. Assign lightweight tasks to smaller runners and reserve high-capacity runners for jobs with heavier demands.
Here’s a quick reference to common bottlenecks and how to address them:
| Bottleneck Type | Identification Method | Mitigation Strategy |
|---|---|---|
| Compute/Memory | Monitor CPU and memory usage on runners[1] | Upgrade resource_class as needed[4] |
| Queue Time | Compare workload to runner capacity[18] | Use autoscaling or spot instances during peak times[1] |
| Network/IO | Track image pull and dependency download speeds[1] | Use container proxies, registry mirrors, or distributed caching[10] |
Testing jobs on various machine types can help pinpoint the optimal setup. For instance, GitLab.com processes millions of jobs monthly using seven runner managers, each running on a Google Cloud Platform n1-standard-1 VM. This standardized approach simplifies fleet management[19]. To further streamline operations, group similar runners using tags (e.g., docker-builds-2vCPU-8GB) so jobs automatically run on the right hardware without manual intervention[19].
"The performance of the CI/CD jobs on the runner fleet is directly related to the fleet's environment. If you are executing a large number of resource-intensive CI/CD jobs, hosting the fleet on a shared computing platform is not recommended." – GitLab Documentation[19]

Once you've optimized caching, parallel execution, and resource allocation, the next step is choosing an infrastructure that can handle fluctuating demands. SurferCloud offers elastic compute servers and a global network designed to minimize latency and support distributed CI/CD pipelines.
With 17+ data centers around the world, SurferCloud lets you deploy runners closer to your repositories and deployment targets. This reduces network delays that can slow down build processes. Paired with elastic compute resources that scale both vertically and horizontally, SurferCloud delivers the performance and flexibility needed to run high-speed pipelines - without the hassle of managing physical hardware.
Here’s how you can make the most of SurferCloud’s compute and data center capabilities to supercharge your CI/CD workflows.
Efficient caching and parallel testing are great for speeding up pipelines, but strategically deploying cloud servers can take performance to the next level.
SurferCloud's scalable compute servers can act as self-hosted runners for your CI/CD tools, whether you're using GitLab, Jenkins, or another platform. This allows you to customize each runner to match the specific needs of your jobs. For example, lightweight tasks like linting can run on smaller instances, while resource-heavy builds can utilize instances with more CPU power and memory.
You can scale horizontally by deploying multiple runners or scale vertically for CPU-intensive tasks by upgrading individual instances. Setting up SurferCloud instances as self-hosted agents is straightforward, giving you complete control over performance and scaling[20][3].
The pricing is flexible, starting at $7.46 per month for a 1-core, 2GB instance, and going up to $111.50 per month for a 16-core, 32GB option. This means you can align your infrastructure with your needs, avoiding overprovisioning while keeping costs manageable - all while maintaining the performance required for demanding pipelines.
But compute power isn’t the only factor. Where you place your runners can also make a big difference.
Network latency can quietly derail even the best-designed CI/CD pipelines, especially for teams spread across different locations. SurferCloud’s 17+ data centers let you deploy runners near your code repositories or deployment targets, cutting down the physical distance data has to travel. This is particularly important when dealing with large build artifacts or container images.
By deploying runners in regional data centers, internal data transfers happen over private networks, which reduces latency and lowers bandwidth costs. When runners communicate with internal registries or cache servers over private IPs, the data transferred typically doesn’t count against your monthly bandwidth limits - a big plus for data-heavy CI/CD workflows[10].
To get the best performance, match your runner's location to the location of your data. For instance, if your main repository is in the U.S., deploying runners in a nearby SurferCloud data center can significantly speed things up. For teams spread across multiple regions, deploying runners in various locations ensures faster feedback loops and keeps build times short.
Maintaining the speed of your CI/CD pipeline is an ongoing process. As tests, dependencies, and infrastructure evolve, performance can take a hit. Regular monitoring helps uncover bottlenecks and provides a roadmap for targeted improvements.
The secret lies in tracking the right metrics. Pay close attention to job and stage runtimes to pinpoint where time is being spent. Keep an eye on your critical path - the sequence of jobs that determines your pipeline's minimum duration. For benchmarking, DORA metrics are a great tool. Elite teams, for instance, achieve a lead time for changes of under an hour and maintain a change failure rate between 0% and 15%. In contrast, less efficient teams might take anywhere from one to six months to get changes into production [21]. These metrics provide the foundation for actionable insights, especially when paired with dashboard analysis and test optimization.
Dashboards transform raw pipeline data into meaningful insights. Instead of chasing individual failures, you can use them to identify patterns - like tests that repeatedly fail at the end of long pipelines or jobs that gradually consume more resources as dependencies grow. Many modern CI/CD platforms come with built-in success and duration charts. For deeper analysis, tools like the GitLab CI Pipelines Exporter can integrate with Prometheus and Grafana, offering custom dashboards for tracking.
Dashboards are also helpful for implementing fail-fast logic. By prioritizing quick jobs early in the pipeline, you can get immediate feedback and identify delays, even if the pipeline doesn't hit the ideal 10-minute cycle.
But dashboards are just one piece of the puzzle. To truly refine your pipeline, you need to dig into the effectiveness of your tests.
Test impact analysis helps you focus on tests that provide the most value while cutting out unnecessary steps.
Start by identifying flaky tests and tracking long-running ones. This prevents redundant re-runs and ensures your testing efforts are justified. For example, in August 2024, Patrick Koss, a Senior Tech Lead, reduced his team’s pipeline duration from 15–20 minutes to just 3–4 minutes. He achieved this by introducing multi-layered caching for Golangci-Lint (cutting its runtime from 2 minutes to 4 seconds) and caching build dependencies (reducing times from 1–5 minutes to just 15–25 seconds) [23].
You can also implement rules to skip irrelevant tests. For instance, if only frontend code has been updated, there’s no need to run backend tests. Martin Schneider, a Delivery Manager, shared how parallel testing infrastructure cut his team’s testing time from an entire day for eight engineers to just one hour, enabling daily releases [13].
A phased testing approach works well for most teams. Start with quick unit tests to catch basic issues, then move on to more complex integration and end-to-end tests in later stages [24]. This method provides fast feedback on common problems while ensuring thorough coverage for critical paths.
Improving the speed of a CI/CD pipeline demands ongoing, thoughtful adjustments. Tomas Fernandez from Semaphore emphasizes this perfectly:
"Speeding up your CI/CD build is never wasted effort. Every second shaved from the pipeline is compounded by how often you commit code into the repository." [3]
Key strategies such as caching, parallel execution, and dynamic resource allocation are at the heart of these enhancements. Together, they can turn slow, inefficient pipelines into fast, streamlined systems.
The impact of these techniques is undeniable. For example, caching alone can reduce build times from 15–20 minutes to as little as 3–4 minutes, while parallelizing tests can shrink a five-minute sequential workload to just one minute [23][25]. Add in right-sized runners and global infrastructure - like SurferCloud's elastic compute servers and its 17+ data centers - and teams can hit the coveted 10-minute deployment mark that sets high-performing teams apart [3]. These numbers clearly show the value of optimization.
To get started, focus on practical steps to refine your pipeline. Start with a configuration audit to identify bottlenecks. From there, prioritize caching and address flaky tests to ensure stability [5][22]. As CircleCI's documentation advises:
"Caching is about achieving a balance between reliability and getting maximum performance. In general, it is safer to pursue reliability than to risk a corrupted build." [7]
Adopt these changes gradually, track performance metrics, and continually fine-tune your process. Faster feedback cycles not only improve development efficiency but also lead to more dependable deployments - driving better outcomes for your business.
Build caching speeds up CI/CD pipelines by saving and reusing previously generated data, like downloaded dependencies, compiled code, or Docker layers. Instead of rebuilding or downloading these components for every job, the pipeline pulls them from the cache, cutting down on both time and resource consumption.
This method minimizes I/O operations and shortens build times, making it especially useful for workflows with frequent builds or large-scale projects. By streamlining resource usage, build caching helps development teams work faster and deliver updates more efficiently.
Running tests in parallel can dramatically speed up your CI/CD pipeline by slashing the overall testing time. By splitting test cases across multiple environments or executors, you often see runtimes drop by half - or even more. This faster feedback loop means developers can address bugs sooner, leading to shorter release cycles.
It’s not just about speed, though. Parallel testing makes better use of available computing resources. Whether you're using local CPUs or elastic cloud services like SurferCloud, you can scale resources as needed. This lets you spin up just the right number of parallel workers without wasting resources, keeping performance high while managing costs efficiently.
Another major benefit? Parallel execution isolates tests, making it easier to pinpoint flaky or slow ones. Since each test runs independently, any failure is directly tied to specific changes, which improves reliability and builds confidence in every deployment.
Optimizing resource allocation in CI/CD pipelines is all about cutting down on waste, speeding things up, and aligning resources with your workload. Here’s how you can make it happen:
By adopting these tactics, you can speed up your CI/CD pipelines on SurferCloud while keeping resource usage efficient and costs steady in USD.


